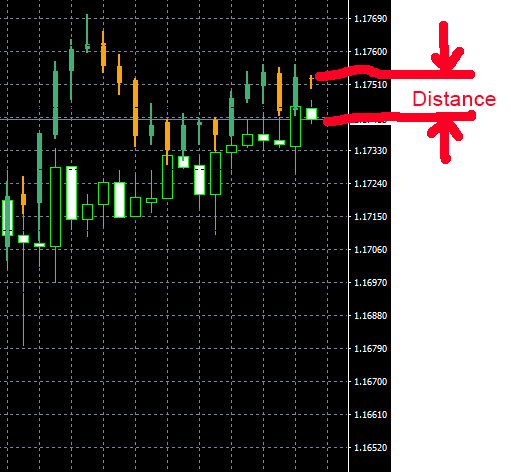
I currently have an 'Overlay' indicator which allows me to plot a main bar chart of, say the EURUSD with another pair, such as the JPYUSD 'overlayed' in the same window. The scale on the right y axis remains as that of the main pair.
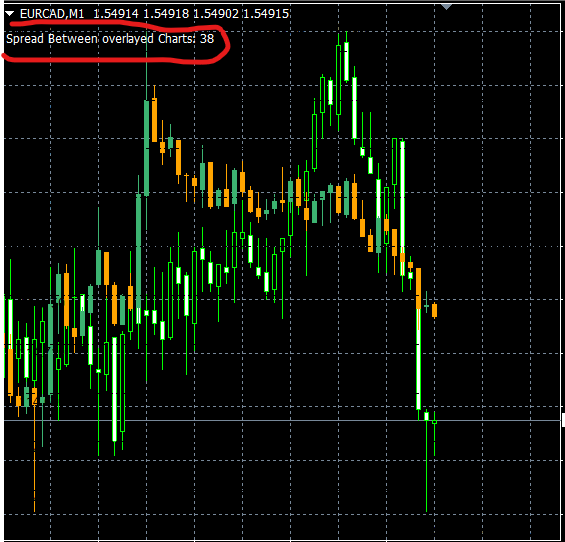
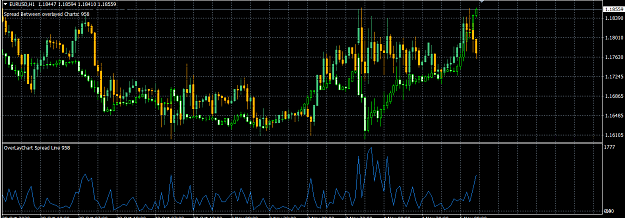
What I am looking for is either a line graph indicator or text number somewhere that shows the numerical value 'spread' or 'distance' between the two plots as measured by the main scale, in the example case EURUSD. See the image which shows what I mean.
Edit. I've also attached the overlay indicator which may be relevant
Attached Image
Attached File(s)
He was looking for the card so high and wild hed never need to deal another