Hi,
First of all, thanks to 919gilead for inventing MADdash and honestknave for programming!
It has occurred to me earlier that past data should also be displayed, and I read a request to that effect here in the forum the other day. In a couple of weeks, a solution was born, as I think.
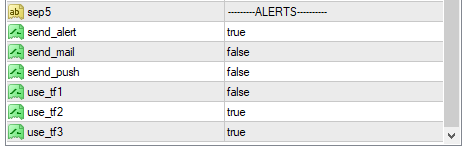
Some settings verbally (others attached as images):
- MA_period, MA_price, MA_method I think is clear,
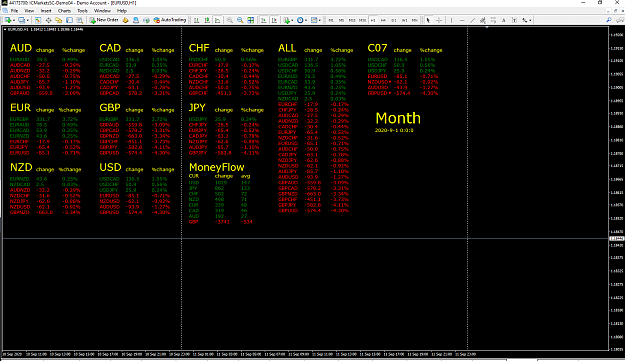
- Threshold: currency strength is in the range of 0-7. If the value is above the threshold, the indicator turns green (eg strong for green), otherwise it remains gray
- Rates_refresh_sec: refreshes every two seconds,
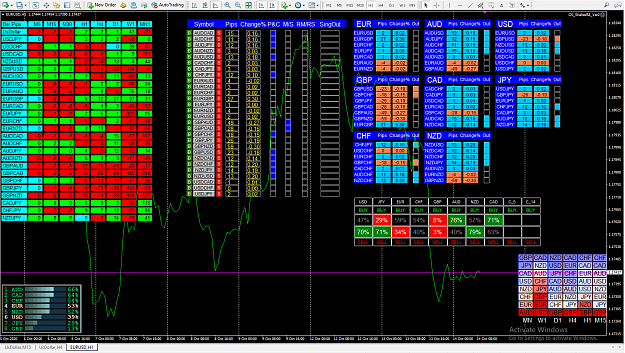
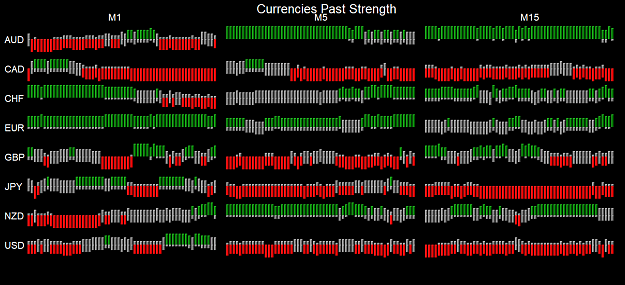
- Visible_bars: number of bars to be displayed per time plane for histogram display,
- bar_with: width of the bar in points,
- bar_space: distance between two bars in points,
- bar_height_multiplier: bar height can be adjusted by multiplying the strength / weakness value by this number,
- show_grid: histogram display can be switched instead of grid.
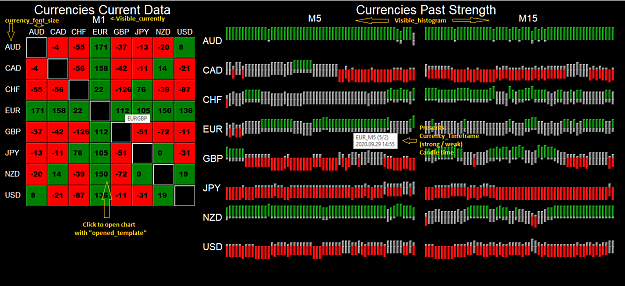
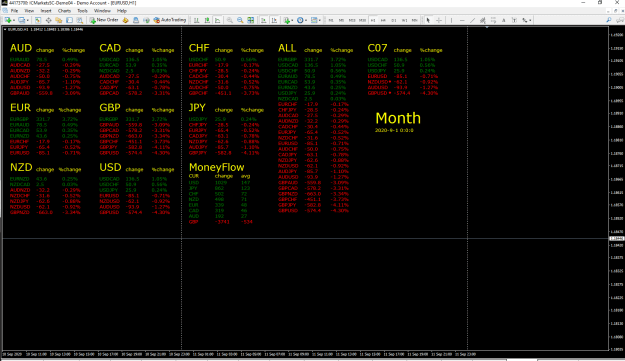
Histogram panels are drawn based on candles that have already been sealed. The Grid panel is the distance of the current (open candle) closing price from the set moving average.
A ‘C’ sign (not yet pictured) has been added to the top left corner, allowing the front panel to switch directly between Hisogram and Grid display.
The indicator automatically recognizes the members of the broker prefix and suffix.
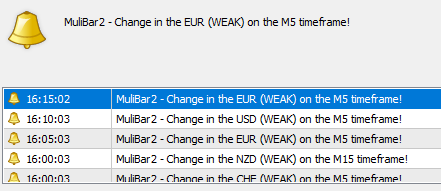
Current version: 2.07_beta (Complete with alarm)
The size of the screen can be very varied, so the number of bars can also influence the parameters of the grid to be displayed - after a little experimentation, everything can be displayed optimally.
With my current knowledge, I have been able to do this, welcome it!
Fx_Jacem
Version updates:
2.07_beta - Complete with alarm
2.06 - Objects of size 0 must also be drawn, otherwise the image will not be correct later
2.05 - I returned my own DeleteAllObjects () function instead of ObjectsDeleteAll ()
2.04 - automatically finds suffix and prefix data for pairs
2.03 - 'C' can be toggled between the grid and histogram in the first panel at the touch of a button
2.02 - rename header
2.01 - grid panel font size adjustability
2.00 - first version
(Sorry for the quality of my writing, I don't know English, I wrote this description with a translator.)
First of all, thanks to 919gilead for inventing MADdash and honestknave for programming!
It has occurred to me earlier that past data should also be displayed, and I read a request to that effect here in the forum the other day. In a couple of weeks, a solution was born, as I think.
Some settings verbally (others attached as images):
- MA_period, MA_price, MA_method I think is clear,
- Threshold: currency strength is in the range of 0-7. If the value is above the threshold, the indicator turns green (eg strong for green), otherwise it remains gray
- Rates_refresh_sec: refreshes every two seconds,
- Visible_bars: number of bars to be displayed per time plane for histogram display,
- bar_with: width of the bar in points,
- bar_space: distance between two bars in points,
- bar_height_multiplier: bar height can be adjusted by multiplying the strength / weakness value by this number,
- show_grid: histogram display can be switched instead of grid.
Attached Image (click to enlarge)
Attached Image (click to enlarge)
Histogram panels are drawn based on candles that have already been sealed. The Grid panel is the distance of the current (open candle) closing price from the set moving average.
A ‘C’ sign (not yet pictured) has been added to the top left corner, allowing the front panel to switch directly between Hisogram and Grid display.
The indicator automatically recognizes the members of the broker prefix and suffix.
Current version: 2.07_beta (Complete with alarm)
The size of the screen can be very varied, so the number of bars can also influence the parameters of the grid to be displayed - after a little experimentation, everything can be displayed optimally.
With my current knowledge, I have been able to do this, welcome it!
Fx_Jacem
Attached File(s)
Version updates:
2.07_beta - Complete with alarm
2.06 - Objects of size 0 must also be drawn, otherwise the image will not be correct later
2.05 - I returned my own DeleteAllObjects () function instead of ObjectsDeleteAll ()
2.04 - automatically finds suffix and prefix data for pairs
2.03 - 'C' can be toggled between the grid and histogram in the first panel at the touch of a button
2.02 - rename header
2.01 - grid panel font size adjustability
2.00 - first version
(Sorry for the quality of my writing, I don't know English, I wrote this description with a translator.)