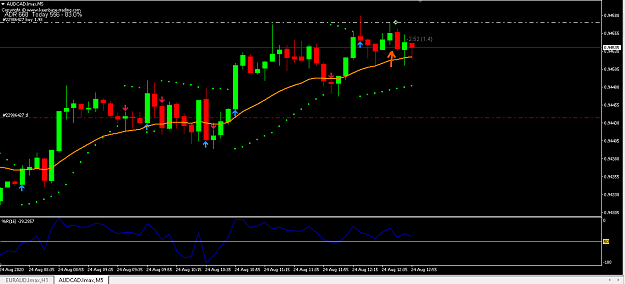
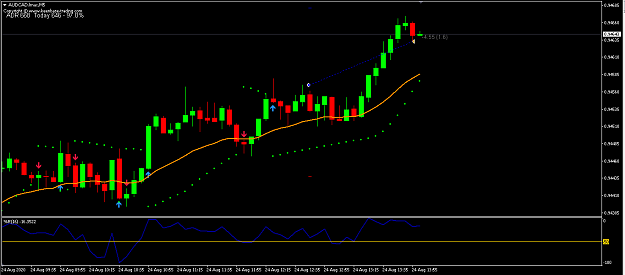
Just a thought I think that when Sar Flips to overbought territory > 80 indicates a possible buy entry and when Sar Flips to signal is oversold territory < 20 indicates a possible sell entry {image}Enjoyiing the thread
Ignored
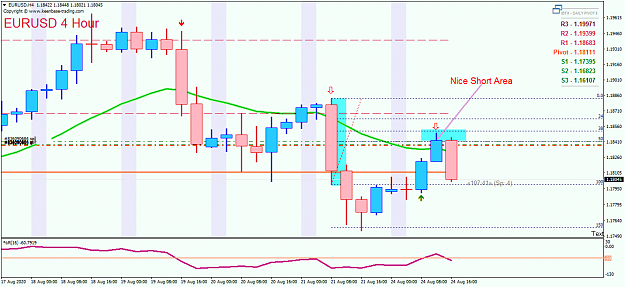
OK, the entry on this pair was at 1.0983 which was the candle close that breached the Asian session high. You're in late.
Again, on a "slow day" just be aware of the higher time frame EMA. If there is no impetus to move price then it generally is not going break the higher time-frame EMA.
Just a thought I think that when Sar Flips to overbought territory > 80 indicates a possible buy entry and when Sar Flips to signal is oversold territory < 20 indicates a possible sell entry {image}Enjoyiing the thread
Ignored
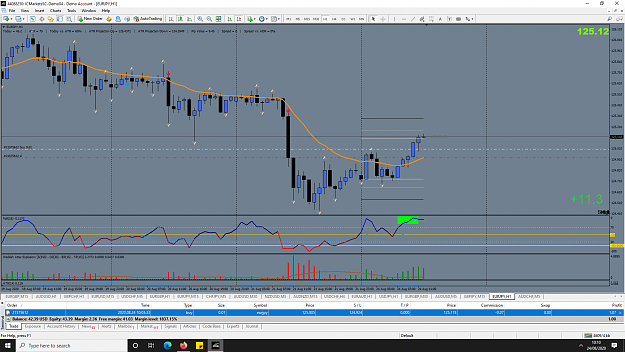
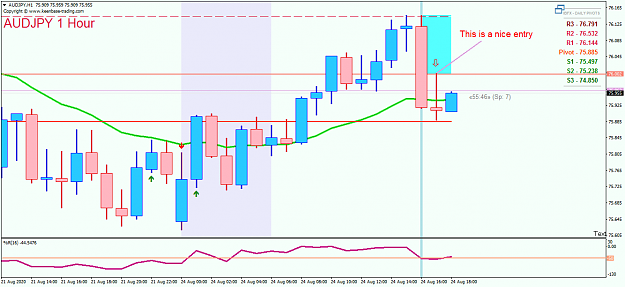
OK, back on track. Better entry was 124.94. W%16 went from under to over on the candle close and SAR's flipped and closed over the 20 EMA AND price is in a daily uptrend in accordance with the 60 Min Chart. Can you see all of that?
{quote} I'm aware of it. In a "quiet" day I am more sensitive to the ADR. If ADR is hit late in a session I am aware of it. If ADR is hit and coincides with higher time-frame S&R I am aware of it. If ADR is breached early in the day AND the market is volatile I am less worried about it. As an example if we look at today; no news, Monday, start of week, no big moves yet....I would be reluctant to take an entry if ADR is breached. And these are the nuances that you need to get your head around. If you enter every time there is a SAR's flip you will...
Ignored
I went long on EU... closed it early on SAR flip before my TP ...
Did you take this long?.. if Yes, where did you exited?
Rob D Better entry was 124.94. W%16 went from under to over on the candle close and SAR's flipped and closed over the 20 EMA AND price is in a daily uptrend in accordance with the 60 Min Chart. Can you see all of that?
Just to say I have noticed trends seem to start in these overbought/sold areas
Rob D Better entry was 124.94. W%16 went from under to over on the candle close and SAR's flipped and closed over the 20 EMA AND price is in a daily uptrend in accordance with the 60 Min Chart. Can you see all of that? Just to say I have noticed trends seem to start in these overbought/sold areas {image}
Ignored
That is a very good observation and you are right. My main trading strategy (60M Slingshots) only enters in the OB and OS areas of Stochastics. It is not valid for this particular strategy but it is a terrific way to trade trends.
Now check out the pressure being applied on the GBP/AUD 1.8230 area. Great S area. IF it breaks this area with a good 60 Min close I'll jump on it. Check out the "clean chart space left" on the 60 Min Chart below the 1.8230 area. That means there are no orders waiting to Buy back in until the 1.8150-60 area. But Bulls have defended this area over the last week. Wait and see, wait and see, wait and see. The life of a trader hey?
Now check out the pressure being applied on the GBP/AUD 1.8230 area. Great S area. IF it breaks this area with a good 60 Min close I'll jump on it. Check out the "clean chart space left" on the 60 Min Chart below the 1.8230 area. That means there are no orders waiting to Buy back in until the 1.8150-60 area. But Bulls have defended this area over the last week. Wait and see, wait and see, wait and see. The life of a trader hey?
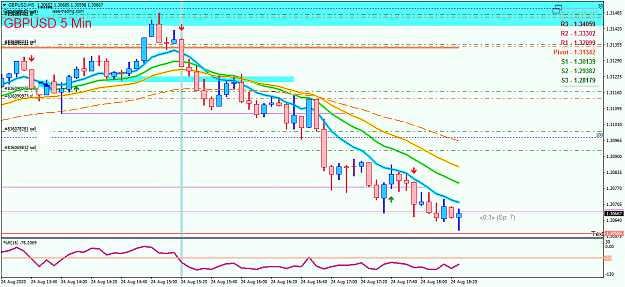
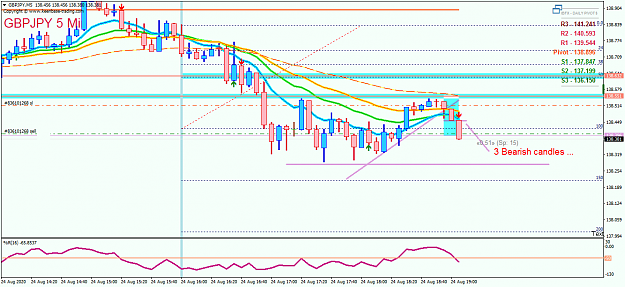
Hi ViVi, my advise .... if your entry on M5, mean your trend M15 is looks nice ... see below H1 bearish engulfing candle close, M15 and M5 .... look for shor entry by using rockypoint methode ...
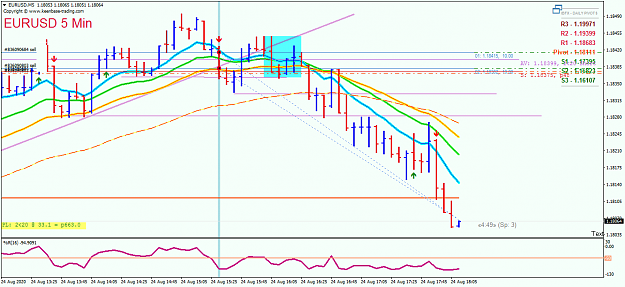
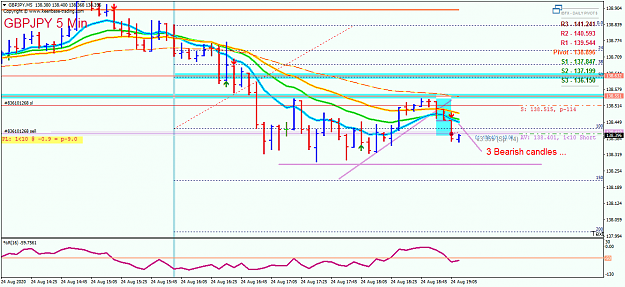
Here is EU ...Short from M5 ...by using rockypoint methods to entry SELL on M5 TF... see H4 Bearish engulfing... just waiting to SELL set up on the pullback ..
entry on the NY open ...