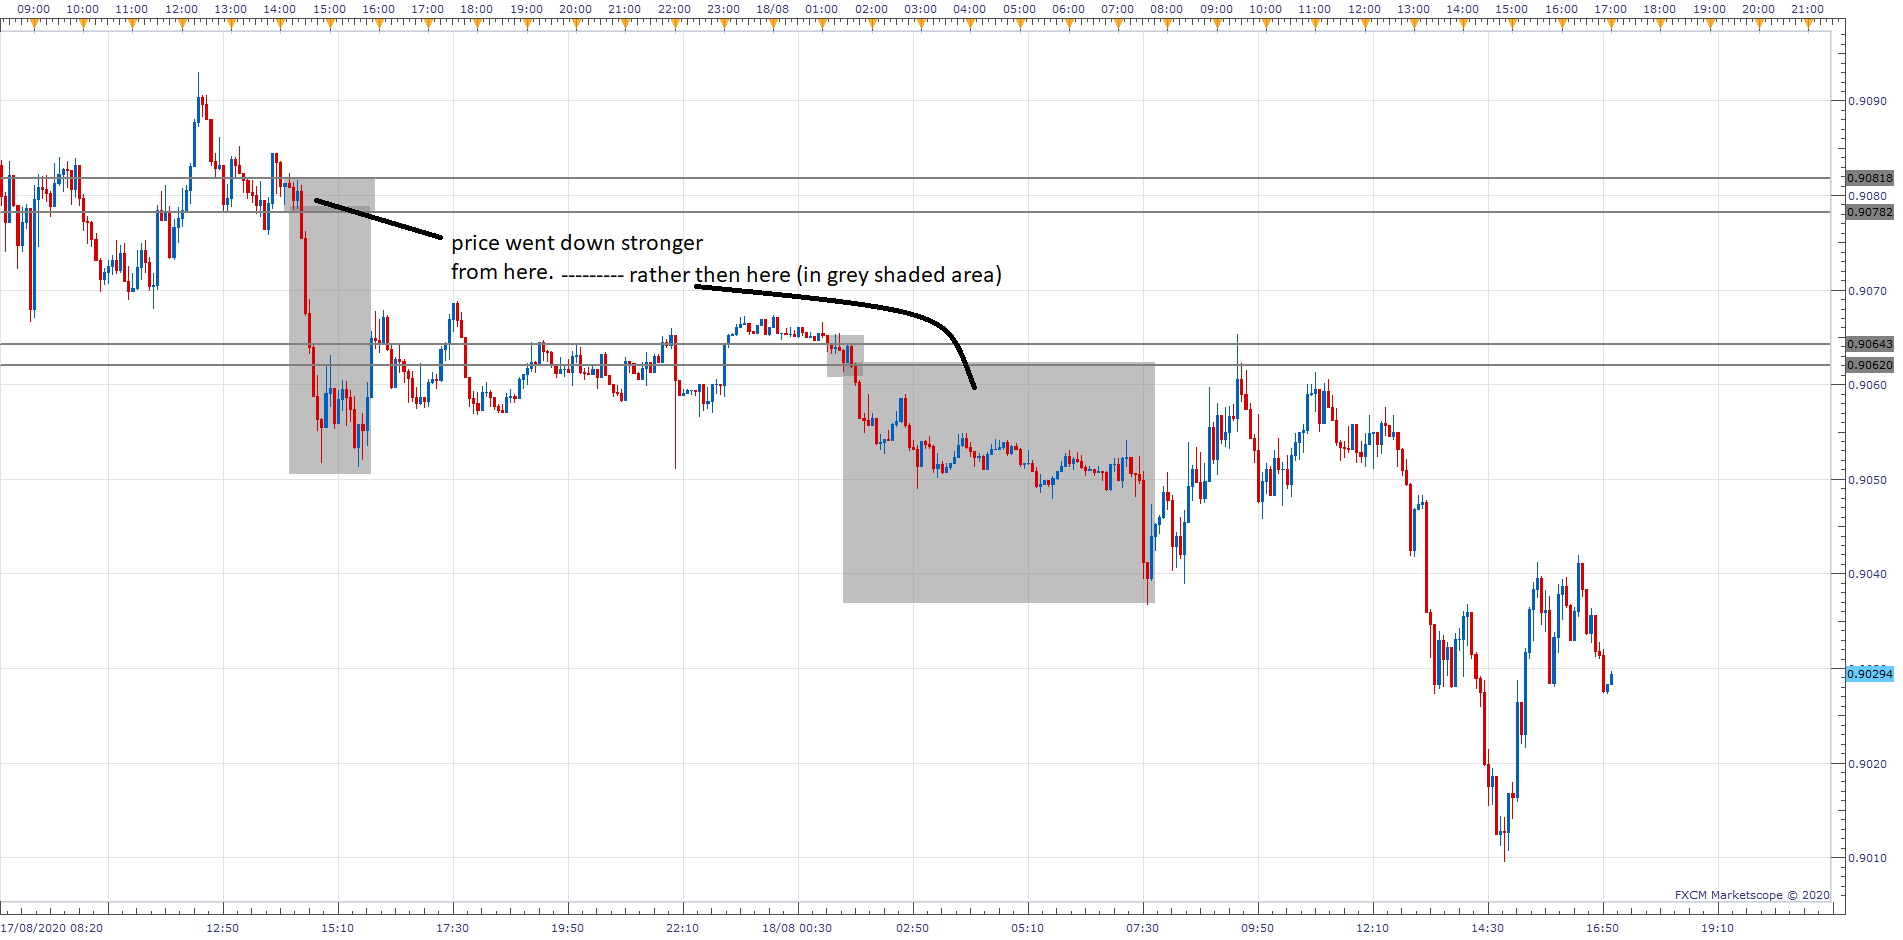
{quote} Why .9080? what is the PA look like? That price level seems like it would be above any stop for any supply shown here.
Ignored
Supply went down harder and stronger from there, means its a lower risk short with higher probability. i tend to get stopped out more on lower time frame as i keep my stops super tights. its how i trade most of the time on lower time frames. i just bailed thinking it would head higher. Im human lol.
Hi guys, hope everyone is doing well?!
First and foremost, I'd just like to say a massive thank you to you AKT for releasing the knowledge you have and starting this thread!
I'm fairly knew to the whole concept of supply & demand trading. I feel as though I have a grasp on it thanks to threads like this and some videos I've came across however I have a couple of underlying questions I'm hoping someone would be able to help out with?
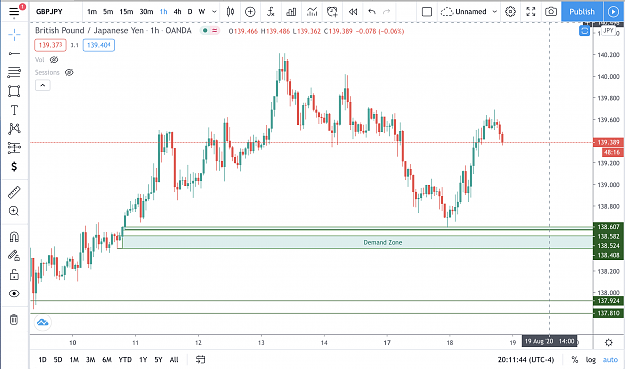
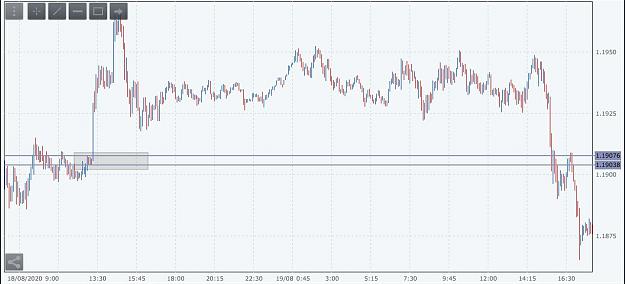
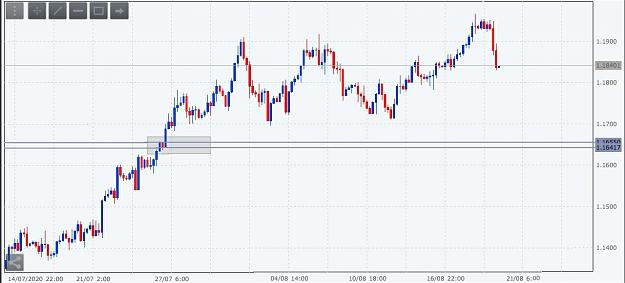
In the attached picture you'll see I've marked out a demand zone on the 1 hour chart that has taken out a previous supply zone. However, instead of retracing back into the demand zone is has came back to a Rally Base Rally zone on the 15 minute chart.
So I guess my question is, Why did price respect a RBR rather than the big up move?
And in terms of inheritance, my understanding is that the zone indicated becomes an inheritance zone but what now are the chances that will be respected?
Hi guys, hope everyone is doing well?! First and foremost, I'd just like to say a massive thank you to you AKT for releasing the knowledge you have and starting this thread! I'm fairly knew to the whole concept of supply & demand trading. I feel as though I have a grasp on it thanks to threads like this and some videos I've came across however I have a couple of underlying questions I'm hoping someone would be able to help out with? In the attached picture you'll see I've marked out a demand zone on the 1 hour chart that has taken out a previous...
Ignored
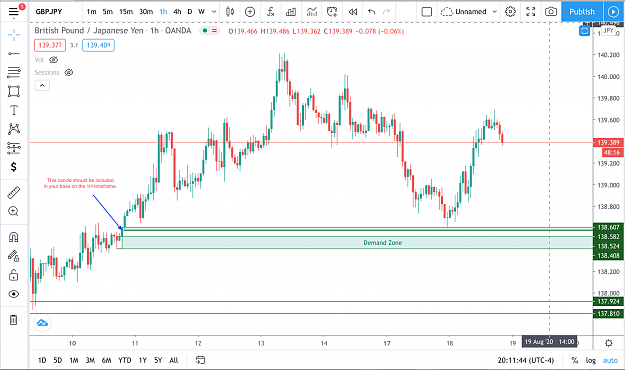
Good job on identifying the area of imbalance on the 1H chart. We just have to get you to pinpoint where the strong movement in price came from. The zone that you picked didn't include all of the basing candles. As a general rule of thumb you want basing candles to be smaller, relative to the surrounding candles. AND/OR the BODY of the candles (Open to Close) to be <50% of the span of the entire candle (High - Low).
I've uploaded a screenshot of the way we draw zones in this methodology.
A good way to get some practice is to go through the thread and look at the uploaded images to see how the zones are drawn. You'll get the image of how a zone is drawn burned into your mind and it'll become second nature for you to draw your zones.
Thanks so much for the feedback!
So am I right in saying that the candle I didn't include as a basing on the 1H is in fact part of the base because its a <50% candle?
Thanks so much for the feedback! So am I right in saying that the candle I didn't include as a basing on the 1H is in fact part of the base because its a <50% candle? Thanks
Ignored
No problem man, where here to help.
Yup that would be part of the 1H base. If you want even more material on zones and the other aspects of the methodology check out "Storehouse Analytics" on YouTube. It's the sister channel to this thread put together by AKT, a member here that started this thread. Pay attention to how he draws his zones.
Brilliant! Cleared that up, thanks for that mate !
You know what I actually just typed AKT into YouTube and Storehouse came up and I've been having a look into it... Extremely insightful!
Once again big thanks to AKT for putting this together.... And thanks to you Masterquis for getting back to me and helping out
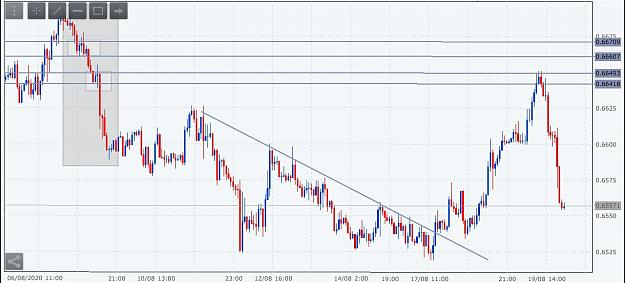
{quote} NICE! you got it right at the top. well done. the post right before yours refers to your chart on a lower time frame (4h). in theory, yes. you can keep shorting the supply zones. there's a few near by for you you have a lower risk short on the upper zone, which would give you the highest reward, with the lowest risk, but we could turn on the lower one which is a nice cap on 4 hour. not to complicate it. chart provided. {image} {image}
Ignored
Got triggered a short for nzdusd @ 0.6644 As the lower supply failed to keep price down.
Guys, I'm sorry to be that guy who is always looking for an answer but I have one more question How can you know whether to trade the zone that broke the opposing supply/demand or whether to trade the inheritance of said zone? Thanks in advance
Ignored
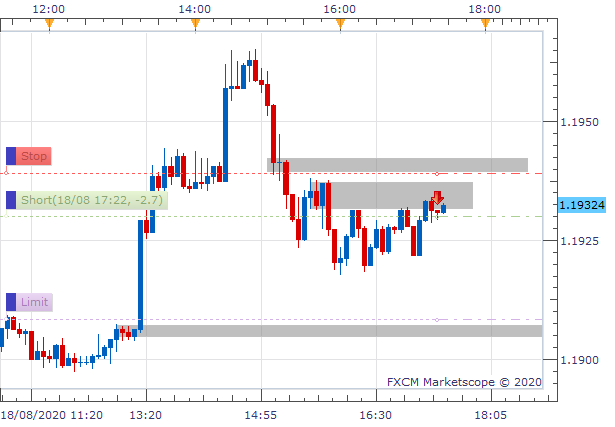
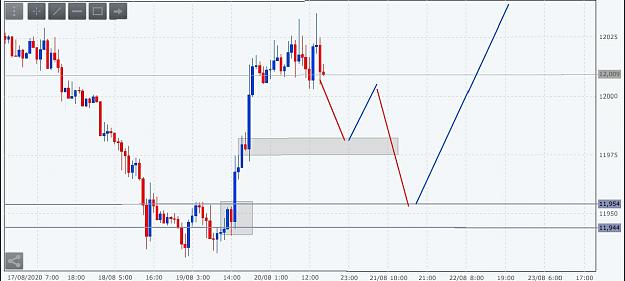
If it breaks you don't have the right zone OR we are coming from a higher time frame supply/demand, even then on lower time frame it will retrace 20 pips or 100 pips before continuing. Trading lower time frames you get alot more swings that tend to take out zones alot easier. If you trading or expecting a trade to go in a certain direction, it's crucial to look on a higher time frame chart as that will hint to you at what price wants to do. I am wrong sometimes with zones as I don't look on higher time frame. For example. I took a trade (chart provided) at demand which blew passed my entry with a retracement on the down side and back up to test it. That was my exit and I bailed. . 5min chart I saw the upside potential but I failed to look at 1h and 4h which then hinted it wanted to go down. I was wrong, but it told me very quickly. You can normally take the other side of the trade (short in my case now) untill a demand lower down comes into effect.
When you have the right zones, price is like a ping pong or magnet that bounces of eachother. All you doing is taking a trade that has bounced off a zone somewhere.
{quote} NICE! you got it right at the top. well done. the post right before yours refers to your chart on a lower time frame (4h). in theory, yes. you can keep shorting the supply zones. there's a few near by for you you have a lower risk short on the upper zone, which would give you the highest reward, with the lowest risk, but we could turn on the lower one which is a nice cap on 4 hour. not to complicate it. chart provided. {image} {image}
Ignored
Check out the 4h chart which has 4h supply lower down and higher supply. Go into a lower time frame and you will see the fresh supply
{quote} It has but it went into a supply. {quote} Check out the 4h chart which has 4h supply lower down and higher supply. Go into a lower time frame and you will see the fresh supply
Ignored
I'm lost, if the 4hr trendline is broken why are you still selling 4hr supply.
Or was it because that 4hr supply was nested in a daily supply?
Can you use a picture to explain your 2nd post. I don't think I get you
{quote} I'm lost, if the 4hr trendline is broken why are you still selling 4hr supply. Or was it because that 4hr supply was nested in a daily supply? Can you use a picture to explain your 2nd post. I don't think I get you
Ignored
The trend line was broken, but that allowed price to head into the higher supply here for another shorting opportunity
I'm on a tablet and can't explain on the chart like I normally do. Sorry. This is the best I can do for now.
Hi Guys, I just wanted to ask you a question about the MTF analysis. When you have your sequence already set, for example mine is 4H for the curve, 1H for Trend and 15M for entry.
Do you guys often look at the 1 time frame higher very often? or you are strictly looking at your set time frame sequence?
I was going through some of the trades I took, the bad ones and I noticed that sometimes looking at the daily would actually help, but on the other hand I don't want to get mixed up with too many timeframes and get confused by over analyzing the pairs.
Hi Guys, I just wanted to ask you a question about the MTF analysis. When you have your sequence already set, for example mine is 4H for the curve, 1H for Trend and 15M for entry. Do you guys often look at the 1 time frame higher very often? or you are strictly looking at your set time frame sequence? I was going through some of the trades I took, the bad ones and I noticed that sometimes looking at the daily would actually help, but on the other hand I don't want to get mixed up with too many timeframes and get confused by over analyzing the pairs....
Ignored
I look at 6/7 time frames. So long as you know the underlying momentum, it's fine. Works for me.
{quote} I look at 6/7 time frames. So long as you know the underlying momentum, it's fine. Works for me.
Ignored
Ok, but do you have you base time frame? For the curve? Or you just take any TF as your curve and then you drill down, looking at 6/7 time frames might be exhausting, do you have a base that you you use? Thanks
{quote} Ok, but do you have you base time frame? For the curve? Or you just take any TF as your curve and then you drill down, looking at 6/7 time frames might be exhausting, do you have a base that you you use? Thanks
Ignored
I normally trade lower timeframes but I keep an eye on daily and weekly.
I normally get stopped out when I forget to look at htf