1
 Planetary Cycles Trading (EUR/USD)
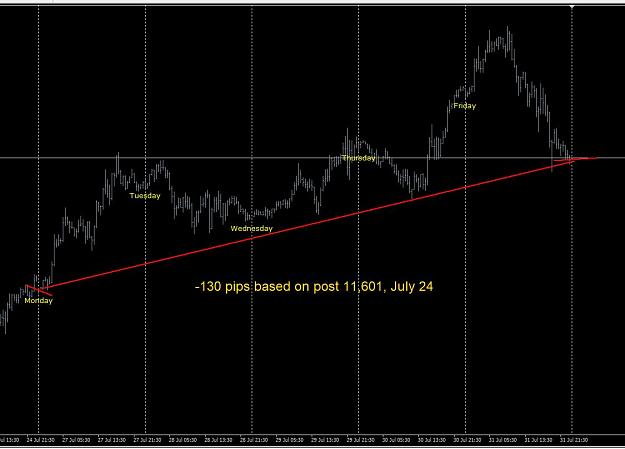
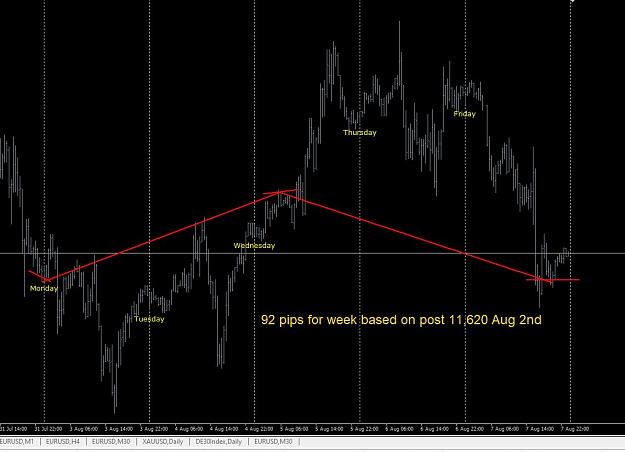
- #11,621
- Aug 2, 2020 3:02pm Aug 2, 2020 3:02pm
- Joined Feb 2007 | Status: Trader | 3,248 Posts | Online Now
- #11,622
- Aug 2, 2020 3:04pm Aug 2, 2020 3:04pm
- Joined Feb 2007 | Status: Trader | 3,248 Posts | Online Now
- #11,623
- Aug 2, 2020 3:10pm Aug 2, 2020 3:10pm
- Joined Feb 2007 | Status: Trader | 3,248 Posts | Online Now
- #11,626
- Aug 8, 2020 7:56pm Aug 8, 2020 7:56pm
- Joined Feb 2007 | Status: Trader | 3,248 Posts | Online Now
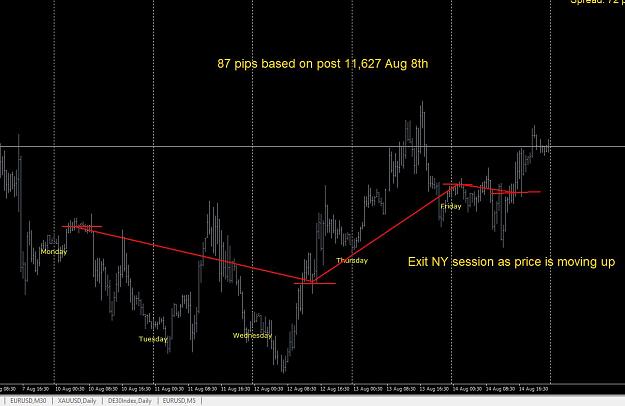
- #11,627
- Aug 8, 2020 8:10pm Aug 8, 2020 8:10pm
- Joined Feb 2007 | Status: Trader | 3,248 Posts | Online Now
- #11,629
- Aug 9, 2020 7:42pm Aug 9, 2020 7:42pm
- Joined Sep 2018 | Status: Trader Man | 2,149 Posts
"No pain no gain"
- #11,631
- Aug 14, 2020 4:08pm Aug 14, 2020 4:08pm
- Joined Feb 2007 | Status: Trader | 3,248 Posts | Online Now
- #11,632
- Aug 14, 2020 4:09pm Aug 14, 2020 4:09pm
- Joined Feb 2007 | Status: Trader | 3,248 Posts | Online Now
- #11,634
- Aug 15, 2020 8:57pm Aug 15, 2020 8:57pm
- Joined Feb 2007 | Status: Trader | 3,248 Posts | Online Now
- #11,636
- Aug 16, 2020 10:25pm Aug 16, 2020 10:25pm
- Joined Feb 2007 | Status: Trader | 3,248 Posts | Online Now
- #11,638
- Aug 17, 2020 7:50am Aug 17, 2020 7:50am
- Joined Sep 2018 | Status: Trader Man | 2,149 Posts
"No pain no gain"
- #11,639
- Aug 17, 2020 8:13am Aug 17, 2020 8:13am
- Joined Feb 2007 | Status: Trader | 3,248 Posts | Online Now
- #11,640
- Aug 17, 2020 8:17am Aug 17, 2020 8:17am
- Joined Feb 2007 | Status: Trader | 3,248 Posts | Online Now