Joined Aug 2010
|
Status: absolute beginner
|5,469 Posts
ok, i will watch the %levels in the next weeks and let you know what is my observation. i prefer to watch GU and maybe EU, because they are for the most important world currencies.
trading is like dancing, don't think and just listen to the music!
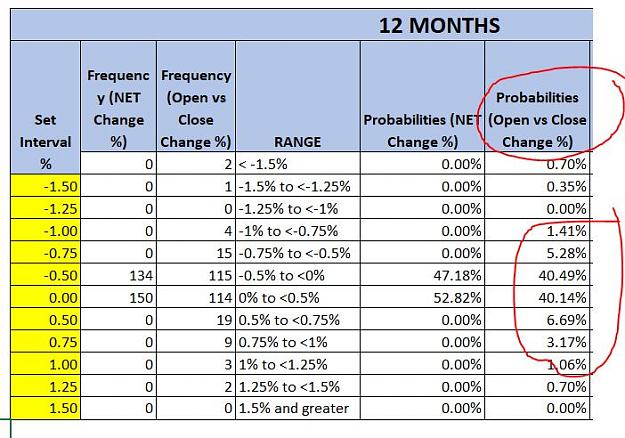
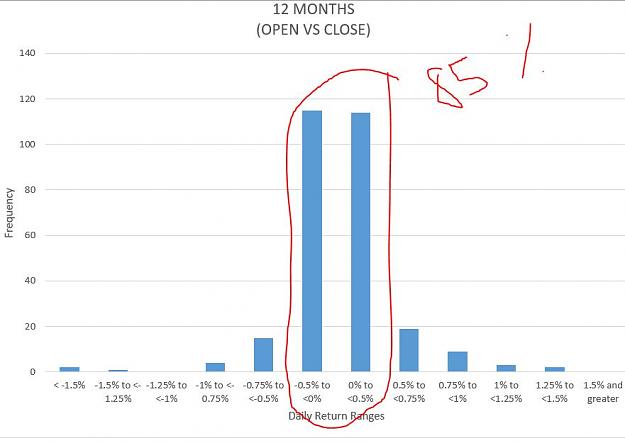
Some of you are confused so I will clarify. These lines are nothing more than .25% .50% .75% 1% of the days move (from the open) above or below the market. We know for a mathematical fact that the market stays/closes within a plus or minus .50% move 85% of the time. SEE MY PREVIOUS POST WITH 1 year DATA SPREADSHEET ^^^ Your entire trading strategy and most importantly your Money Management rules should all be built off this fact. I specifically use these levels for calculating risk because if the market stays within the plus or minus .50% range...
Ignored
Hi
If the price closes exp: positively at +5 today (as you said, 85% of the market closes at this price) what do you think is a more logical deal for tomorrow?
Is it better to sell for tomorrow?
sorry my eng bad
{quote} LDFX Either you are being smart or stupid, I do not which one. I told you to contact a person for ACCESS to a live trading room where I can show you how to obtain 1-2% every single day. I was not talking about that waste of time FTMO thread - God help me. READ THE MESSAGE AGAIN - and show some humanity please. You see I enjoy helping traders in the process of being profitable in this game. Here was a message from a trader just last week who I gave some simple advice on. Do you get any of theses? no probably not. {image}
Ignored
Hi RickM can I join that group too? I would love to learn from you... Give me one chance please
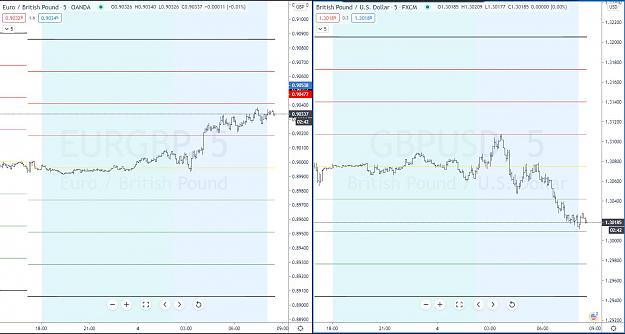
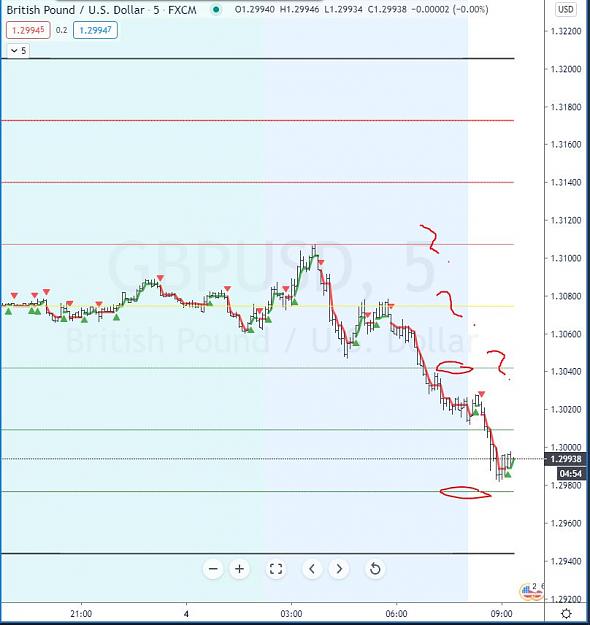
This morning I had two trade signals one of them was long the EURGBP and the other short the GBPUSD however we are already at the .50% levels so if I am going to take these trades I can not do any big sizing my target is not great maybe 20 pips to the .75% and my stops are going to need to be much further away.
This is an example of statistical trading.
You can only get what the market is willing to give you. Could both of these trades trend all day and go past 1%? sure they could but the probabilities of that are only 10% so I sure as heck hope they do but if they do not it is fine I will lock in some profits at .75% and or trail a stop if they both turn into winners. The other option would be to just not trade them at all and find another trade that has better probabilities and better targets and stops.
just a quick question, why using 0.25 to 1% per pair instead of the ATR ? Aren’t there pairs that move more or less on a daily basis than others, like 0.125 to 0.5 ?
Also take xauusd for example, in April 2013 the daily atr14 was 38usd when it was trading at ~1360usd. More than 7 years later it is 30usd trading at ~1970. Yet a 1% move in April 2013 was 13.6usd and now it is 19.7usd, the price going up makes the % higher while the volatility has actually decreased. Longer ATR like 55 still makes it a daily 25usd excursion even 7 years after while 1% of the asset is now ~45% bigger..., doesn’t this mesure go against volatility?
Or perhaps I haven’t understood at all the 0.25>1 levels ?
The GBP worked great so knowing what I know statistically, I can now even move my stops to break even. I am not telling you what I am doing I am merely showing you how you can use statistics to make better trade decisions
{quote} CeeSo, just a quick question, why using 0.25 to 1% per pair instead of the ATR ? Aren’t there pairs that move more or less on a daily basis than others, like 0.125 to 0.5 ? Also take xauusd for example, in April 2013 the daily atr14 was 38usd when it was trading at ~1360usd. More than 7 years later it is 30usd trading at ~1970. Yet a 1% move in April 2013 was 13.6usd and now it is 19.7usd, the price going up makes the % higher while the volatility has actually decreased. Longer ATR like 55 still makes it a daily steady 25usd excursion over...
Ignored
I posted these Frequency Distributions Earlier but I should be posting them on every page of this thread. Over and over and over again till people understand you can never beat MATH.
If you really wanted to get sophisticated you could find the exact percentages of the moves for example the exact average move could be 54% but I find that unnecessary for what I personally do.
The GBP worked great so knowing what I know statistically, I can now even move my stops to break even. I am not telling you what I am doing I am merely showing you how you can use statistics to make better trade decisions
Ignored
This is what I am trying to do, understand the statistical edge, therefore my question. Which I think you could answer without disclosing your strategy, no ?
{quote} I posted these Frequency Distributions Earlier but I should be posting them on every page of this thread. Over and over and over again till people understand you can never beat MATH. If you really wanted to get sophisticated you could find the exact percentages of the moves for example the exact average move could be 54% but I find that unnecessary for what I personally do. {image} {image}
Ignored
First, how were you able to accurately measure those excursions on backtesting? As far as I know it is impossible because the numbers are on daily close, it can not measure the maximum excursion DURING the day, your graphics show that very well, it is open vs close.
Second, why not using ATR instead as the excursion in % is only relative to the price therefore not showing the accurate average volatility the more the data sampled, as my example on a post above about xauusd where the price is now ~45% higher than in 2013 while the volatility hasn’t increased.
{quote} First, how were you able to accurately measure those excursions on backtesting? As far as I know it is impossible because the numbers are on daily close, it can not measure the maximum excursion DURING the day, your graphics show that very well, it is open vs close. Second, why not using ATR instead as the excursion in % is only relative to the price therefore not showing the accurate volatility average the more the data sampled.
Ignored
You can use an ATR that is fine I used them for sizing successfully as well I am not saying that you can not or should not.
The problem I personally have with ATR is it becomes harder to Quantify it over a large sample. Of course, you could quantify it but this is just a lot easier for me to work with.
I would like to know the probability of every trade I take working.
So for example: If I take that GBPUSD short signal (I posted above) at the -.50% level what are the exact probabilities it will hit the -.75% or the -1% and beyond level.
This is super easy for me to calculate. That makes it very easy to figure out my sizing and stops.
{quote} You can use an ATR that is fine I used them for sizing successfully as well I am not saying that you can not or should not. The problem I personally have with ATR is it becomes harder to Quantify it over a large sample. Of course, you could quantify it but this is just a lot easier for me to work with. I would like to know the probability of every trade I take working. So for example: If I take that GBPUSD short signal (I posted above) at the -.50% level what are the exact probabilities it will hit the -.75% or the -1% and beyond level....
Ignored
Well you didn’t really answer my questions.
If your probabilities are calculated on a backtesting that doesn’t account for the max negative and positive excursion then your probabilities are false.
But I reckon that if those false probabilities however give you the confidence to systematically place trades, stops or whatever, easily and consistently then it might be an edge after all...
But still, I think you would be better off with the ATR.
All that matters to me if I take this short signal at the -50% what is the exact probability it will hit the -75% or beyond.
By knowing this as well as knowing what stop level I should use and the percentage chances that that stop will get hit I can size the trade appropriately to make sure my risk is controlled over and over and over again with great ease.
I am not predicting the market I am just working with what is probable. To quantify every single trade I take.
This way you can build a database of the highest probability trades that suit your personal risk tolerance.
All that matters to me if I take this short signal at the -50% what is the exact probability it will hit the -75% or beyond. By knowing this as well as knowing what stop level I should use and the percentage chances that that stop will get hit I can size the trade appropriately to make sure my risk is controlled over and over and over again with great ease. I am not predicting the market I am just working with what is probable. To quantify every single trade I take. This way you can build a database of the highest probability trades that suit your...
Ignored
I understood that very well.
The problem is that what you call probabilities are not because your backtesting was made only possible on the daily open vs daily close which is very different than daily open vs daily high/low.
Only you can decide what is an acceptable risk for you.
I just want to be very clear on if I decide to take risk what are the probabilities it will work.
I know a trader that takes trades with a 20% probability but his money management is based off the fact he has very tight stops and his average Risk vs Reward is 1:8.5
He is wildly profitable but I personally could never stomach losing 8 trades out of every 10 trades I take.
I am extremely happy with a 1:1.5 average risk vs reward with much lower variance.
To figure any of these numbers out you must be able to quantify every trade and database them as accurately as possible.
{quote} I understood that very well. The problem is that what you call probabilities are not because your backtesting was made only possible on the daily open vs daily close which is very different than daily open vs daily high/low. I sincerely hope I am wrong, believe me
Ignored
I have all the data as well for the Daily highs and Lows but for the purposes of this thread the instances of large swings are not that important at this time but yes, of course, there are going to be wild swings but 90% of the time these happen during Risk-Off events and I never trade when the market is Risk Off.
{quote} I have all the data as well for the Daily highs and Lows but for the purposes of this thread the instances of large swings are not that important at this time but yes, of course, there are going to be wild swings but 90% of the time these happen during Risk-Off events and I never trade when the market is Risk Off.
Ignored
Would you mind to share those datas with daily open vs high/low ?