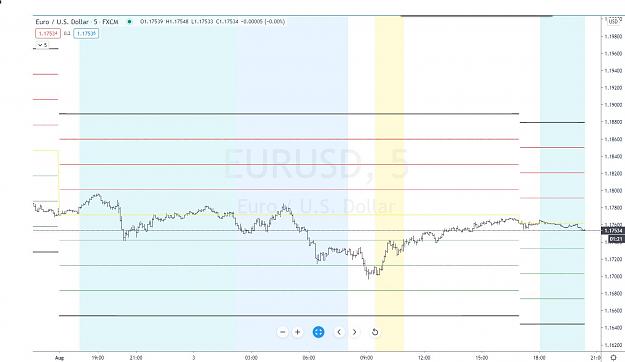
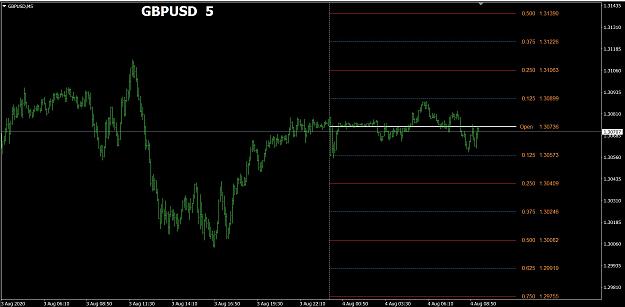
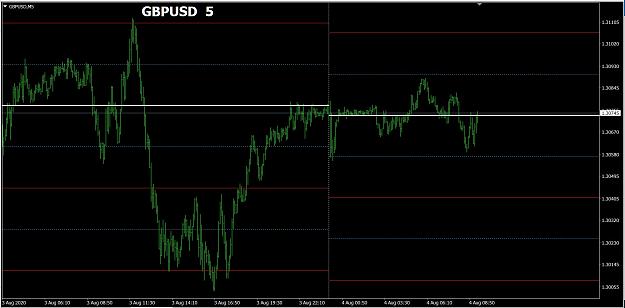
DislikedSome of you are confused so I will clarify. These lines are nothing more than .25% .50% .75% 1% of the days move (from the open) above or below the market. We know for a mathematical fact that the market stays/closes within a plus or minus .50% move 85% of the time. SEE MY PREVIOUS POST WITH 1 year DATA SPREADSHEET ^^^ Your entire trading strategy and most importantly your Money Management rules should all be built off this fact. I specifically use these levels for calculating risk because if the market stays within the plus or minus .50% range...Ignored
You said “fooled by randomness” several times, is it because of the book “fooled by randomness, the hidden role of chance in life and in the markets “ ?
If so then you would understand why I am asking this ? Is a 1 year spreadsheet enough to get on these conclusions or just being “fooled by randomness “ ?
LDFX Trading Ltd