DislikedWell damn what can I say, it was going good while it was going good hey.I got stuck in EU's strong bull run yesterday after being certain that it was going to pullback lower, but unfortunately its final push up higher during the Asian session put my account into the red, and then Murphy's Law today it has pulled back and is now reversing into what would have been a profit for me, well bugger it. My account isn't done, but I did lose the profit accumulated thus far, and a lot of time and effort building it up. This...
Ignored
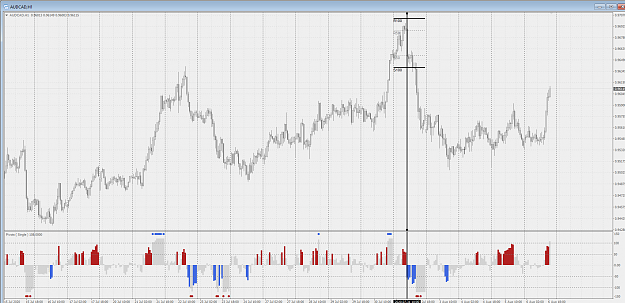
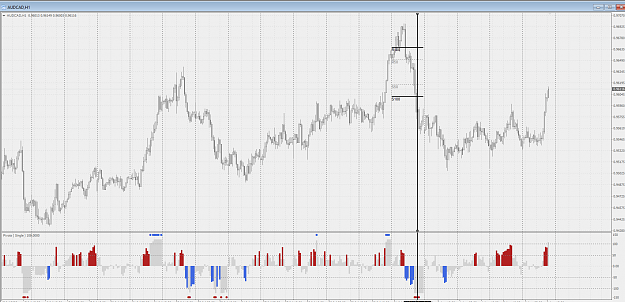
But this time I post for another reason. You posted a template with a few tools. One of them have an interesting behavior. I'm making a version for can plot past history ( i will use histogram 0/100% range ). I will post without expiration maybe next week if I can finish it. Basically range days you play with 50% levels and normal days with 100% range. If I'm not wrong about last week observations then you can almost mechanize trading avoiding have analyze much. This can give you a help for avoid bad days ( you can set small SL with safety )
Try don't lose pants never...
5