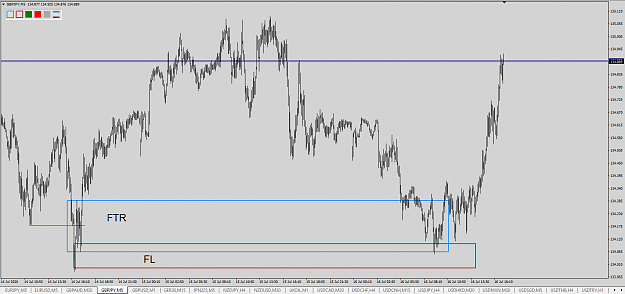
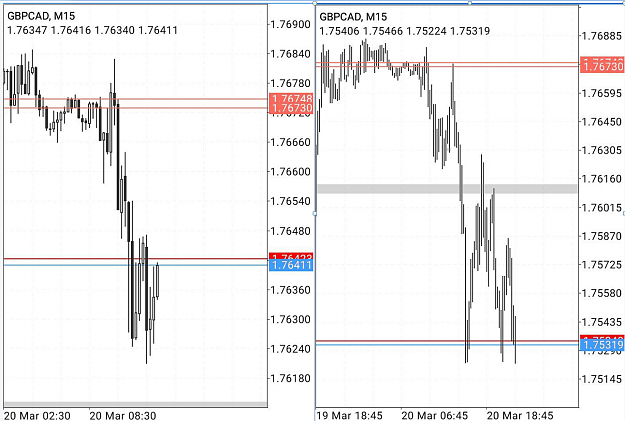
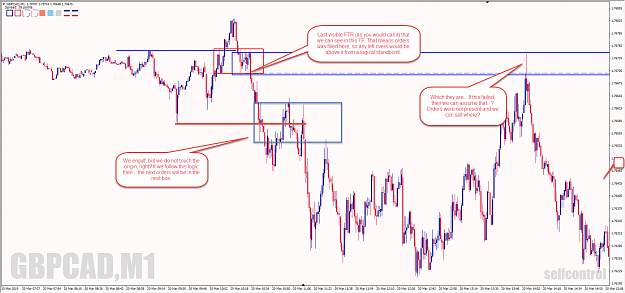
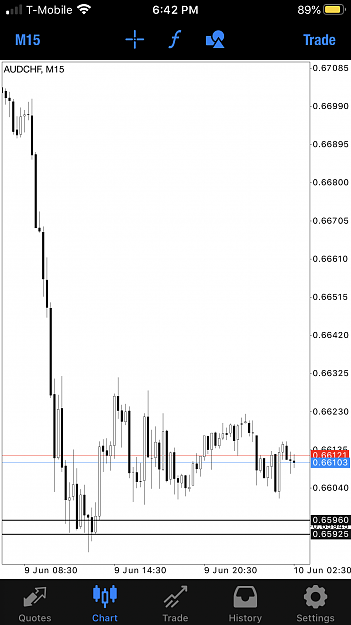
Dislikedhi , i have some doubts regards flags . Here i post a first flag which engulf important SR then i mark the flag in 1 st picture that 1st blue flag engulfed and formed a ftr i mark that as a flag in red box in 2nd picture again that red box engulfed by another flag . in quick times . so my question is which flag engulf i consider as a valid one https://charts.fyers.in/1931243a0a619982f58d3277086444d3/98f447ca901ecbcd37ef63f13a457145.png (https://www.google.com/url?q=https%3A%2F%2Fcharts.fyers.in%2F1931243a0a619982f58d3277086444d3%2F98f447ca901ecbcd37ef63f13a457145.png&sa=D&sntz=1&usg=AFQjCNE5G-vVPGco8MCQPzpscknNSAjD9w)...Ignored
I had the same questions as you for a while. To set this clear from the start, only with hours of practice will you start noticing which ones are the important ones and understanding why from the mind set of who is placing there buy/sell orders there (smart money or fooled money), but let me see if I can help.
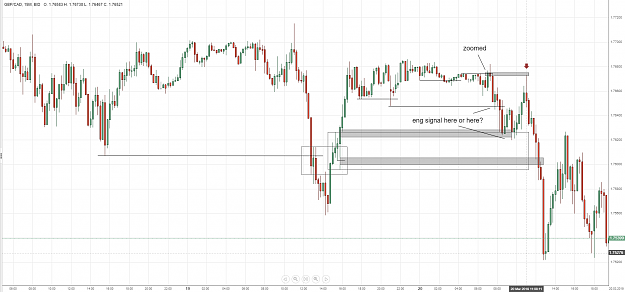
Before I give you an explanation, you are drawing what we know as FTRs, or failures to return after an engulf of an important level, such as the S/R you mentioned in the first link.
First, the initial blue FTR or Lower Flag Limit (I use them almost interchangeably), you drew from the base of candles on top, I would recommend, especially at the beginning, to draw them until the wick. And if you notice there was a reaction to this before the engulf (it appears so at least), so I would not say that price did not react to it.
Once this was engulfed, you have the red upper flag limit (I would go to a LTF to see where the engulf of the lower blue line took place and mark that area for the UFL). The flag would now be that red line you drew.
Finally, your last blue FTR got faked out. An explanation I can give, is that price went where it had engulf the previous mentioned UFL / FTR. However, that blue FTR as a whole was a perfectly valid place for price to turn.
Another thing to keep in mind is that this level was very obvious, likely many retail SD and S/R traders were buying the touch of the zone or the breakout in that area, so ITs wanted to get their sell orders (Stop Losses) Just below at the kink where it engulfed the previous UFL and now formed a LFL, or an FTR.
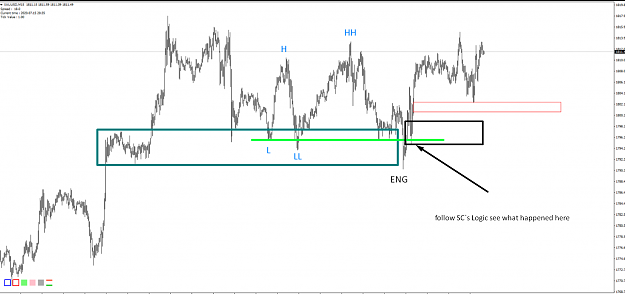
please note that FTRs and FLs are practically interchangeable (or are used as so) The Flag Limit specifically describes the edges of a flag, while the FTR does not need to do so. For conceptual purposes, the Upper and Lower FLs are formed with the flag, otherwise it is just and FTR, I would not necessarily say one is more important than another, as an FTR in one TF can be an FL in another. The language is more usually used for precision when discussing a chart.
Hope this helps, I know it was packed with theory that perhaps might be new to you. So I repeat, once you have hours of ass time on the charts this will become more intuitive once you keep it in mind.
Cheers!
1
1