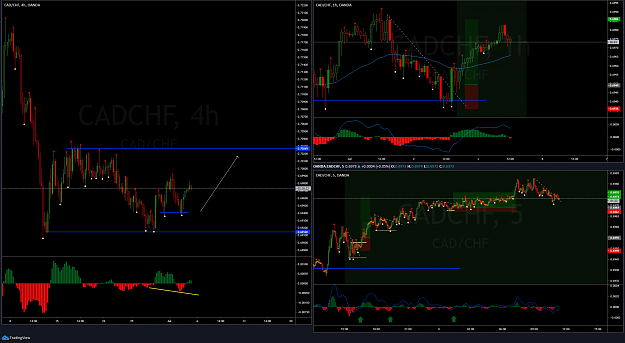
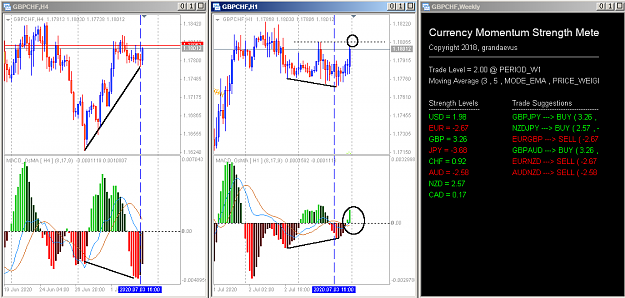
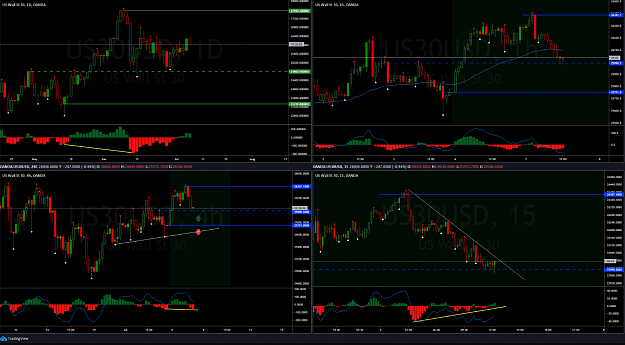
DislikedThat is what I trying to ask @chamane On D1 the HD still progressing and there are two entries in H4 and along with two Trading Zones on M15 {image}Ignored
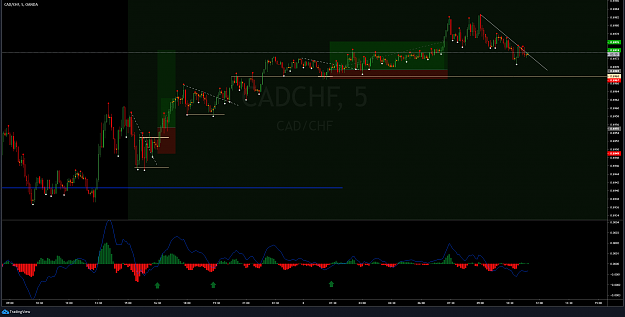
If I follow you correctly, I would only consider the first trendline on the Daily chart as indicating a HD pattern. The second one is rather showing another cyclic move IMO. Then the first Trading Zone you are drawing would be the one I would consider on the 4HR chart. You can see that the signals you got on the 15 min chart in that Zone are giving a winning situation overall. One signal might be a losing one but the first 2 signals are winning.
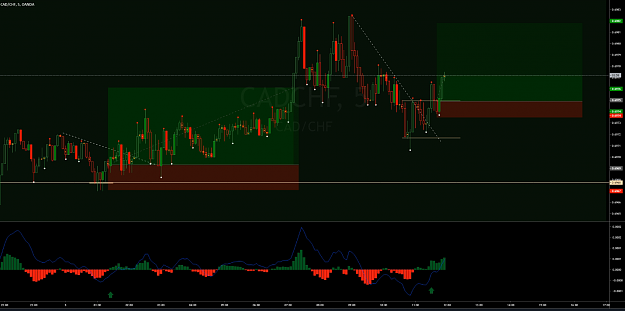
The beauty of the Cost Averaging approach is that you can use it with almost any indicator signal. I would not relate your second Trading Zone on the 4HR chart to a HD pattern, but you can take signals on the 15 min chart as well. More often than not, you will get an overall winning situation. When I have any doubt in my analysis, I rely greatly on that approach to make my decisions.
2