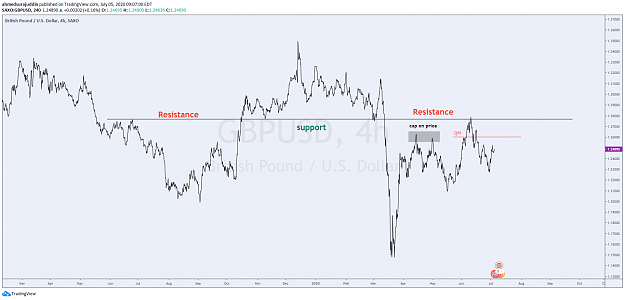
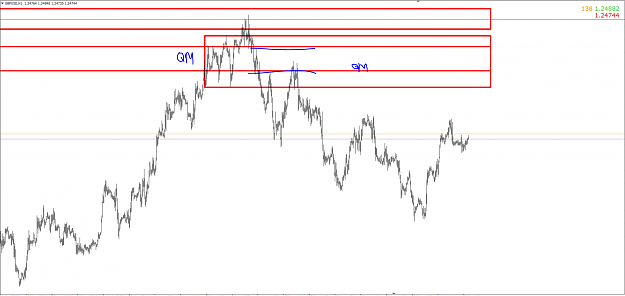
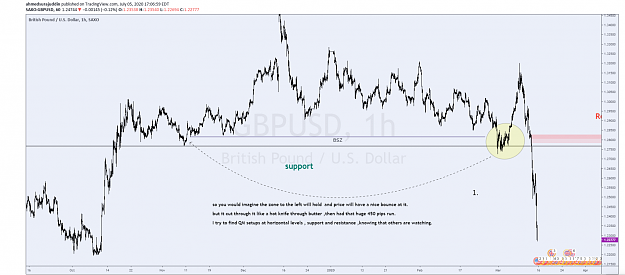
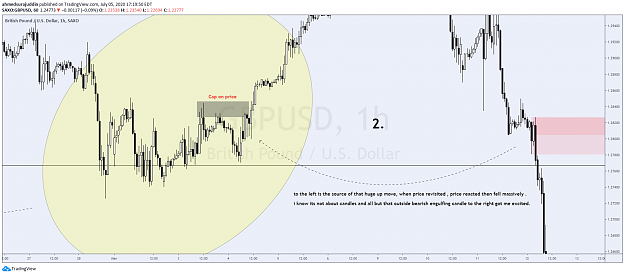
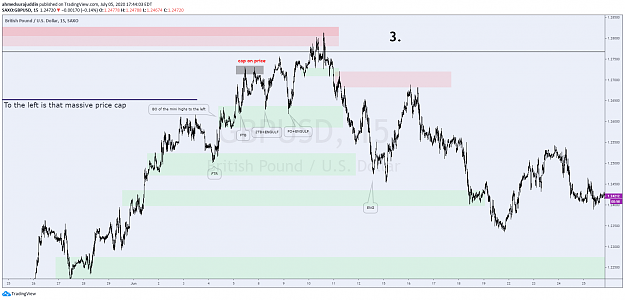
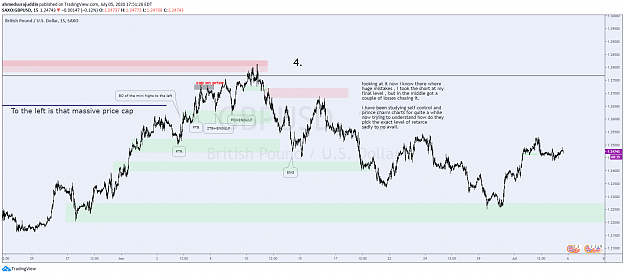
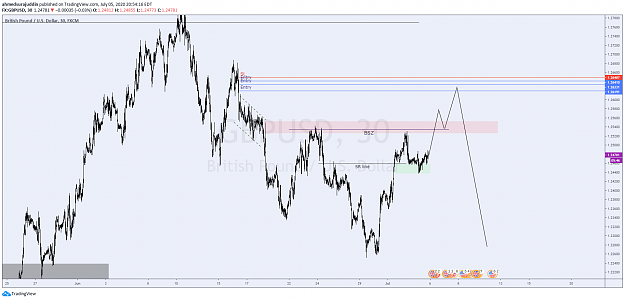
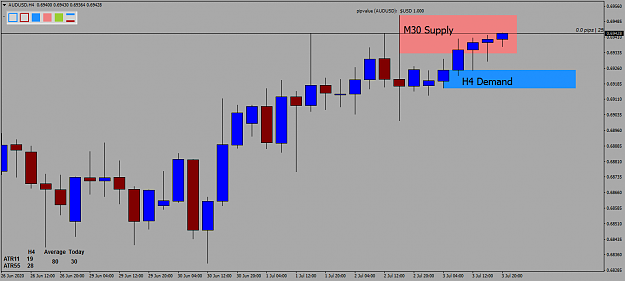
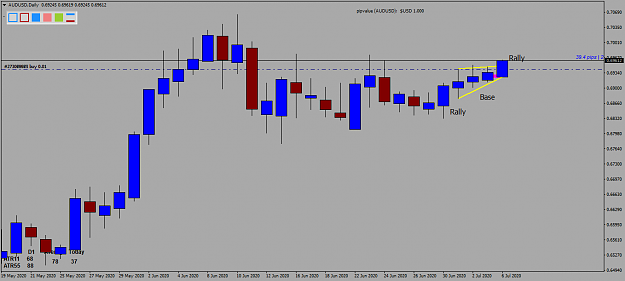
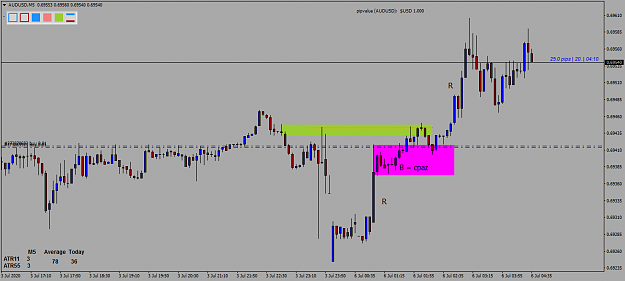
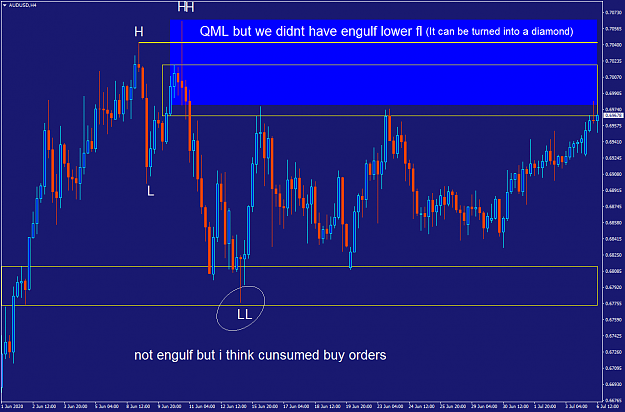
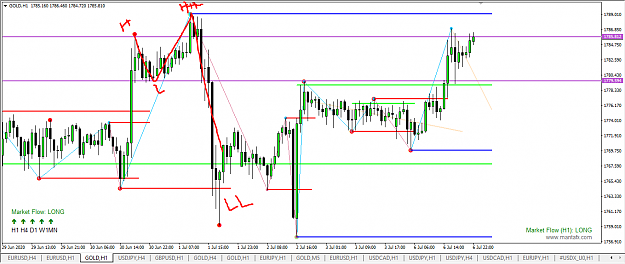
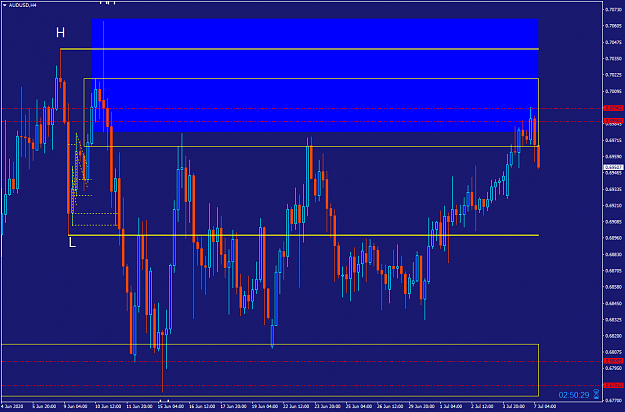
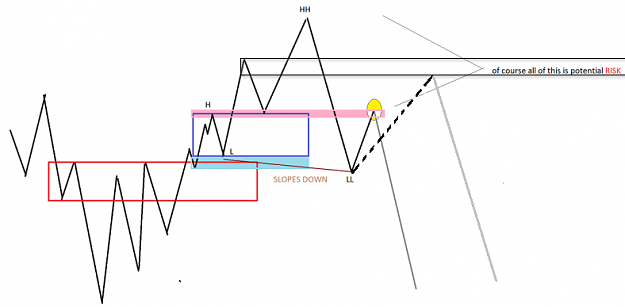
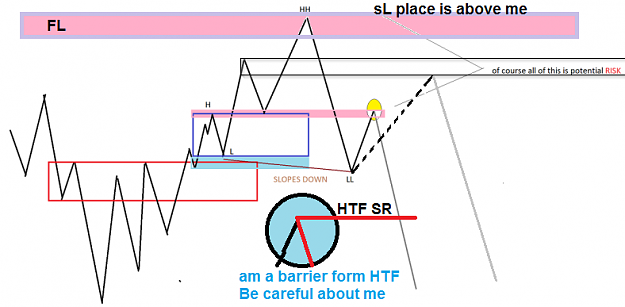
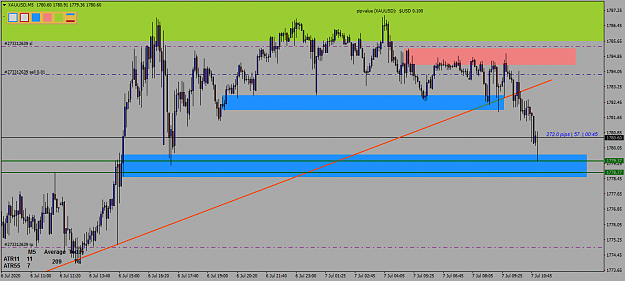
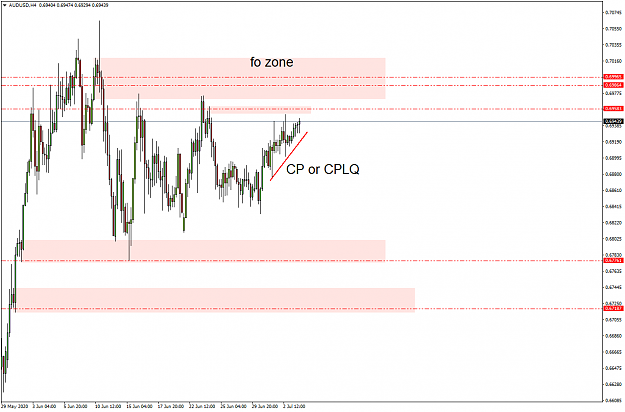
Hi guys . I am new to this topic .I love the RTM method and also Master IF and other masters. I decided to share here what I learned from chart analysis. It will be an honor for me to hear your feedback and guidance. thanks guys
Attached Image (click to enlarge)
1
1