Outlook for next week...
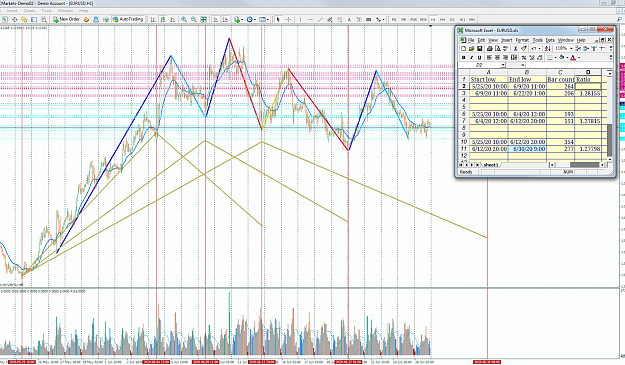
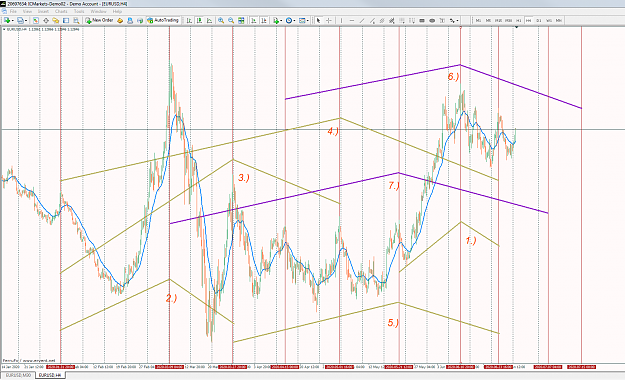
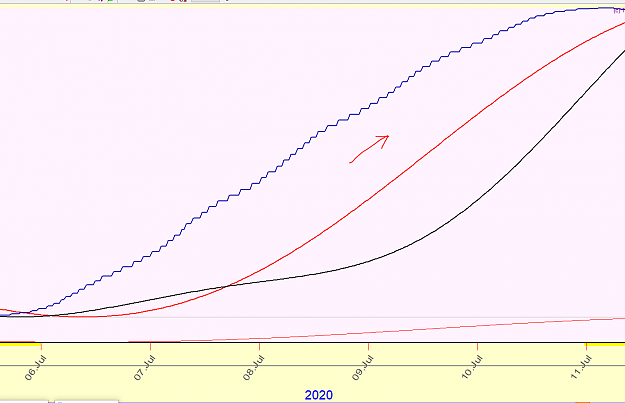
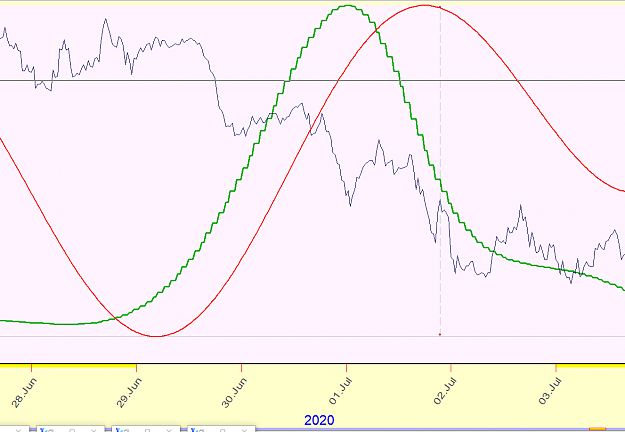
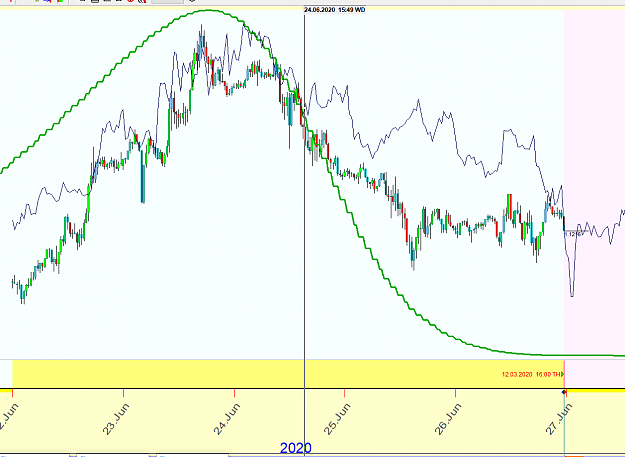
Green line is a return to Jupiter-Neptune 40h, 100% sm orb... it nailed the PA for last week perfectly. The red line is a spectrum study, picking the cycle peaks and distilling them using the Harmonic box function. The black line is a similarity study from March 12, 2020. The 2nd image shows how PA was in march relative to June 22-27 and how Jupiter-Neptune (same settings) looked on the price data.
Green line is a return to Jupiter-Neptune 40h, 100% sm orb... it nailed the PA for last week perfectly. The red line is a spectrum study, picking the cycle peaks and distilling them using the Harmonic box function. The black line is a similarity study from March 12, 2020. The 2nd image shows how PA was in march relative to June 22-27 and how Jupiter-Neptune (same settings) looked on the price data.
Attached Image(s) (click to enlarge)
3