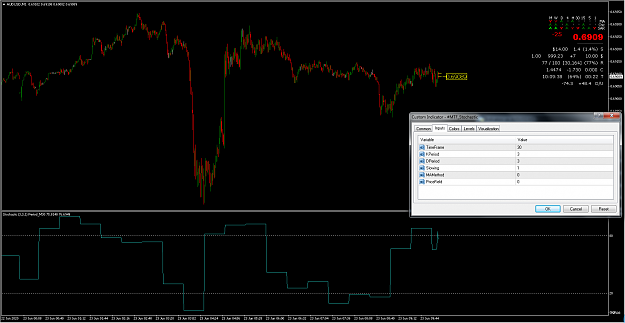
{quote} As far as I know, and assuming that I understand you correctly, something like this:{image} {file}
Ignored
Thanks for your time and response. what will stochastic 3,1,1 in 30mins be in one minute? e.g, will it be 35,1,1 or 90,1,1 without using the mtf indicator. Hope i have been able to communicate my question now.
Thanks for your understanding.
what will stochastic 3,1,1 in 30mins be in one minute? e.g, will it be 35,1,1 or 90,1,1 without using the mtf indicator. Hope i have been able to communicate my question now.
Ignored
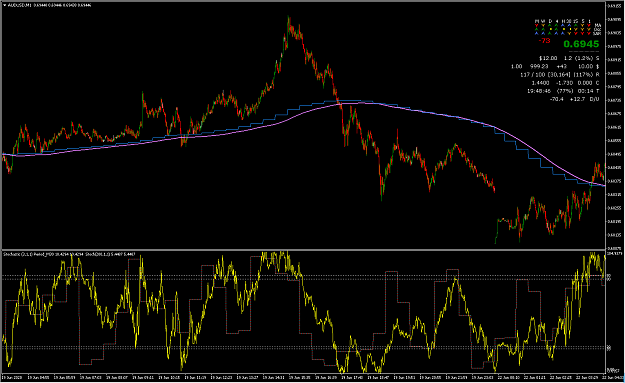
I know you can do this type of thing with SMAs (e.g. a SMA(600) on M1 is approx the same as a SMA(20) on M30 — see the chart below), but I wouldn't automatically assume that something similar applies to stochastic, because it's calculation is completely different and it measures rate of change. By way of experiment, I tried superimposing charts with many different %K values (10,20,30,35,50,90,100,120,150,200,300, etc) over the MTF plot, and none of them came close to aligning perfectly.
{quote} I know you can do this type of thing with SMAs (e.g. a SMA(600) on M1 is approx the same as a SMA(20) on M30 — see the chart below), but I wouldn't automatically assume that something similar applies to stochastic, because it's calculation is completely different and it measures rate of change. By way of experiment, I tried superimposing charts with many different %K values (10,20,30,35,50,90,100,120,150,200,300, etc) over the MTF plot, and none of them came close to aligning perfectly. {image}
I am looking for an indicator show the profit and loss for per bar or candlestick since the entry (for each position).Gain/Loss Info indicator looks closest since it says in its description: Gain/Loss Info indicator — displays the gains and losses for all candles where the given threshold is surpassed. The values are calculated in percentage points and pips: https://www.earnforex.com/metatrader...ain-Loss-Info/
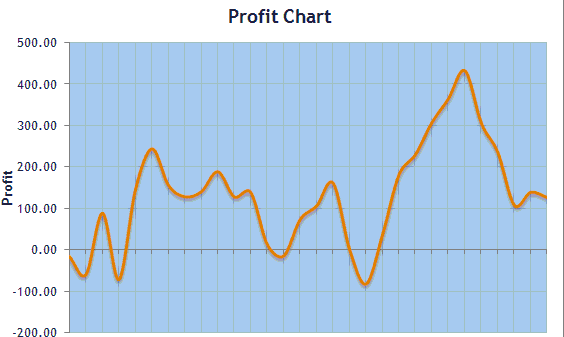
This is the picture of profit and loss indicator type (that is zero meaned )I am looking for.Can anyone help?Thanks.
Is this the same or very similar to profit and loss for per bar indicator?
Ignored
Short answer is that I don't know, as I've never used or developed it further.
Both your links appear to be referring to the same product. From the image in post #1, it seems that it plots the P/L as candles. In cases where the $/pip is constant (i.e. for pairs XXXYYY where your account is denominated in YYY) the P/L should theoretically be exactly proportional to the price values in the candles. However, in the image it appears that only a histogram/candles are plotted; the $ P/L is not printed as a numeric value.
i have indicator for our school (0.236 ) measurements but when i upload at chart the metatrader become more heavy and slow so if you can take a look at the code of indicator to make it light and fast it’s totally 100% fibo
Ignored
Sorry, but I'm unable to help. You could try posting your request on one of the "I code for free" threads, but you'll need to upload the .mq4 file of the indicator, if you want a programmer to modify it for you.
{quote} Jairo, A good question that I've also wanted an answer to myself. I've done a lot of searching on the internet and reached the conclusion that there's no clear cut formula for risk of drawdown -- there are too many variables -- hence the only way is to run Monte Carlo like simulations. This trader has apparently reached a similar conclusion; also Dr Mike Shackleford (whose PhD is in math) makes a similar comment about calculating ROR in the 'Methodology'...
Ignored
Hi David,
Yesterday I literally stumbled upon what seems to be a very simple and practical solution to the problem of estimating the risk of ruin. I keep track of my trades in an Excel spreadsheet, where I take some (hopefully useful) statistics. One of the figures I keep track of everytime I take a trade is the maximum drawdown I had to experience before closing the trade. I was curious about running average and standard deviation of these numbers and then I realized that the risk of ruin comes "automatically" from these calculations, simply "attached" to the the answer to the question "how many standard deviations from the average is the ruin?". There is an obvious subjectivity here, I may think of ruin in terms of 90% drawdown, some may think 50% (or some other percentage) is unacceptable and irrecoverable. But then the probability may be estimated (and used to make decisions) on a trade by trade basis. One aspect I intend to delve into yet is the possibiliy that the drawdown data may have skewness or curtosis, which may distort significantly my estimation.
@BogiFX: see post #1 of this thread. _________________________ @anybody who's interested: Attached is a ZIP containing a comma separated (CSV) file of FF calendar news announcements from Jan 1, 2007 thru Apr 18, 2014, timestamped New York EST (or DST when applicable). The CSV file of 30,678 news announcements can be imported to any platform (e.g. Excel) for further analysis. Columns (from left to right) are: Date, Time, Currency, News description, Impact, Actual, Forecast, Previous, Revised from, Plotted wingdings symbol (ignore), Color value (ignore),...
Ignored
Hi Hanover,
In your post #120 from Apr 18, 2014, you provided a csv file with 7 years of economic datas. Do you still remember where it is possible to download an updated one ?
Yesterday I literally stumbled upon what seems to be a very simple and practical solution to the problem of estimating the risk of ruin.......
Ignored
Hello sir,
It makes sense to me to derive statistics from 'real' data rather than Monte Carlo simulations. However, you would need a large sample size to gain anything that's statistically meaningful. I recall reading in one of the Market Wizard books that a rule of thumb was base position sizes on 2x the worst case drawdown to date, to both allow a margin for error and also taking the conservative stand that 'the worst may be yet to come'. I agree that there's subjectivity in what represents 'ruin', and I'm not sure what level the textbook calculations use. It's a long time since I've looked into RoR.
_____________________________
In your post #120 from Apr 18, 2014, you provided a csv file with 7 years of economic datas. Do you still remember where it is possible to download an updated one ?
Ignored
I've attached an updated version.
If you want the software used to create this file, it's the app News Downloader.exe in the file Plot News 4-16.ziphere. More info here. I used this app to create the sorted csv file.
{quote}Hello sir, It makes sense to me to derive statistics from 'real' data rather than Monte Carlo simulations. However, you would need a large sample size to gain anything that's statistically meaningful. I recall reading in one of the Market Wizard books that a rule of thumb was base position sizes on 2x the worst case drawdown to date, to both allow a margin for error and also taking the conservative stand that 'the worst may be yet to come'. I agree that there's subjectivity in what represents 'ruin', and I'm not sure what level the textbook...
Ignored
Thanks David for your reply. I brought RoR back from my trading grave now that I stepped on its bones, lol. I want to push leverage to some reasonable limit, that's why I need some sort of "RoR tool". Must remember also that black swan events are always prowling, so I should not push too hard.
Hello .. how are you Mr david ?!
mmmm do u have breakout EA work with different tf and in different range of box ... because I found here in FF a lot of breakout EA and indicator and have code of them
but unfortunately it was expired or not work in backtest for small tf
i want it work with 1m;15m ... if u have please share it with me
because I make manual backtest for more that 100 trade and result is fantastic
Hello .. how are you Mr david ?! mmmm do u have breakout EA work with different tf and in different range of box ... because I found here in FF a lot of breakout EA and indicator and have code of them but unfortunately it was expired or not work in backtest for small tf i want it work with 1m;15m ... if u have please share it with me because I make manual backtest for more that 100 trade and result is fantastic
Ignored
Hello sir,
I've never traded breakouts using an automated process.
You could try using to Google to find free MT4 breakout indicators. I found the following links instantly (along with many others) hereherehereherehere. I haven't used any of these and hence I can't recommend them, nor any other products that these folk might be promoting. Good luck, I hope that you can find something that meets your requirements.
{quote} Hello sir, I've never traded breakouts using an automated process. You could try using to Google to find free MT4 breakout indicators. I found the following links instantly (along with many others) herehereherehere...
Ignored
Thanks mr david for replay
mmm but unfortunately none of them work with me as iwant and i use google to search about what i need but ... still didnt found it
btw thanks