• Home
  • Forums
  • Trades
  • News
  • Calendar
  • Market
  • Brokers
  • Login
  • Join
  • User/Email: Password:
  • 4:59pm
Menu
  • Forums
  • Trades
  • News
  • Calendar
  • Market
  • Brokers
  • Login
  • Join
  • 4:59pm
Sister Sites
  • Metals Mine
  • Energy EXCH
  • Crypto Craft

Options

Bookmark Thread

First Page First Unread Last Page Last Post

Printable Version

Similar Threads

Planetary cycles, astrological theory of cycles of the markets 492 replies

Planetary / Astrology indicators 3 replies

Forecast Forex using Numeric Cycles and Astrology Cycles 32 replies

Planetary Cycles... Plotting Cycles into the Future 0 replies

Opinions on "Planetary cycles, astrological theory .. of the markets" 40 replies

  • Interactive Trading
  • /
  • Reply to Thread
  • Subscribe

Planetary Cycles Trading (EUR/USD)

  • Last Post
  •  
  • 1 570571Page 572573574 605
  • 1 Page 572 605
  •  
  • Post #11,421
  • Quote
  • May 26, 2020 5:58am May 26, 2020 5:58am
  •  F.g
  • Joined Aug 2016 | Status: Member | 3,775 Posts | Online Now
This Mars sextile Ouranus on Mo. 2:49 EASTDT marked quite a reversal [LOW]......

Today Tue. plenty of events....Merc. trine Jup. 8:29 ---Merc. opp.Neptune 12:07 --- Mars conj. Pluto 14:08

All HELIO.....
  • Post #11,422
  • Quote
  • May 26, 2020 9:09am May 26, 2020 9:09am
  •  bumapatria
  • Joined Aug 2011 | Status: Member | 10,705 Posts
Quoting F.g
Disliked
This Mars sextile Ouranus on Mo. 2:49 EASTDT marked quite a reversal [LOW]...... Today Tue. plenty of events....Merc. trine Jup. 8:29 ---Merc. opp.Neptune 12:07 --- Mars conj. Pluto 14:08 All HELIO.....
Ignored
what;s your interpretation for risk assets: EURCHF, S&P500, EURUSD? USDCNH? Cheers friend..

I'm concerned about ERIS square pluto and saturn...
Have I got something on my face, SOLDIER?
  • Post #11,423
  • Quote
  • May 26, 2020 10:57am May 26, 2020 10:57am
  •  F.g
  • Joined Aug 2016 | Status: Member | 3,775 Posts | Online Now
Quoting bumapatria
Disliked
{quote} what;s your interpretation for risk assets: EURCHF, S&P500, EURUSD? USDCNH? Cheers friend.. I'm concerned about ERIS square pluto and saturn...
Ignored
Man, hi.

I follow DOW and Euro usually.
Euro, I had a bearish anticipation which evaporated...by PA.......

DOW , I believe it has room to move up a few more days till 3 June + or- ...... Then collapse.

ERIS , I don't follow......

Regards.
  • Post #11,424
  • Quote
  • May 27, 2020 10:57am May 27, 2020 10:57am
  •  F.g
  • Joined Aug 2016 | Status: Member | 3,775 Posts | Online Now
10:55 EST E=1.09 85 after a top at 1.10 31..... wavewise looks like a top in my eyes....
  • Post #11,425
  • Quote
  • Edited at 1:14pm May 27, 2020 12:40pm | Edited at 1:14pm
  •  santoso_am
  • | Joined Sep 2010 | Status: Member | 76 Posts
Quoting santoso_am
Disliked
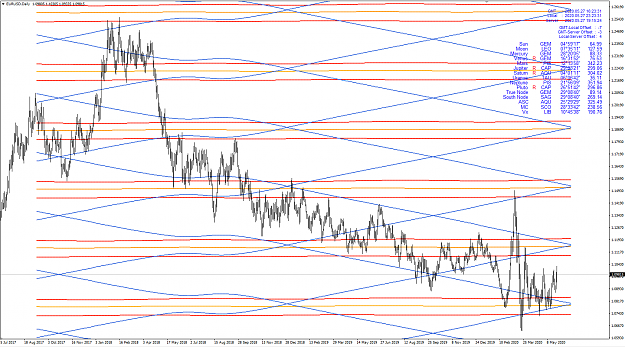
Disclaimer Research purpose only {image}
Ignored
TTTTA LBf - KeepItSimple
update from last year

Attached Image (click to enlarge)
Click to Enlarge

Name: eurusd ff.png
Size: 79 KB
  • Post #11,426
  • Quote
  • May 27, 2020 4:21pm May 27, 2020 4:21pm
  •  jnevins
  • Joined Feb 2007 | Status: Member | 2,098 Posts
Mario of 4X other way has posted a new video on how to use the Moon Sidereal and Synodic cycles in MT4 using the Fibonacci Time tool... well worth watching.

Inserted Video
1
  • Post #11,427
  • Quote
  • May 27, 2020 4:27pm May 27, 2020 4:27pm
  •  jnevins
  • Joined Feb 2007 | Status: Member | 2,098 Posts
Quoting ahmedaminwor
Disliked
{quote} https://www.forexfactory.com/showthr...11#post8433011
Ignored
Oh wow, 5 years ago... I haven't used it to say how it works out in the long run. The gravitational pull of the Moon is linked to the Synodic Cycle though. My main, go to Astro setting these days in Timing Solution is the Moon-Sun which is the Synodic Cycle. So it is well worth looking into with lots of back testing.
  • Post #11,428
  • Quote
  • May 27, 2020 4:27pm May 27, 2020 4:27pm
  •  fx2022
  • | Additional Username | Joined Mar 2020 | 32 Posts
Quoting jnevins
Disliked
Mario of 4X other way has posted a new video on how to use the Moon Sidereal and Synodic cycles in MT4 using the Fibonacci Time tool... well worth watching. https://youtu.be/KLKmaXG4pEg
Ignored
do you still stand behind your forecast of a cit tomorrow into Friday?
  • Post #11,429
  • Quote
  • May 28, 2020 4:49am May 28, 2020 4:49am
  •  santoso_am
  • | Joined Sep 2010 | Status: Member | 76 Posts
Quoting iman_oracle
Disliked
Hi there, what does c.p (and par) mean in Aspectarian aspects? Every time Venus c.p with Jupiter (Natal), the Bitcoin price rises (more than 10 percent). {image}
Ignored
Par = paralel
C.p = contra paralel

Paralel = same declination
contra paralel = opposition declination
1
  • Post #11,430
  • Quote
  • Edited at 6:16am May 28, 2020 5:13am | Edited at 6:16am
  •  santoso_am
  • | Joined Sep 2010 | Status: Member | 76 Posts
Quoting pejman-m
Disliked
{quote} Does anyone know?
Ignored
Valency of Conjunction
show relationship conjunt aspect only,
the idea if we see many conjunct benefic planet,
instrument is assumed upturn.
example: sameday we have mer0°jup,ven0°nep,sun0°ura.
based on theory, stock will upturn.
And Conversely. As the complexity.

but there's no guarantee.


36 Planetary Combinations and 5 Aspects

Bradley would then consider every relation that these nine planets were forming with each other - yielding a total of 36 (8 + 7 + 6 + 5 + 4 + 3 + 2 +1 =36) planetary combinations.
What is a relation between two planets ? In astronomy and astrology the planets are mapped on a circle of 360 degrees. If you divide this circle into equal parts you get harmonic divisions. I.e. a division of 4 yields 90 (360/4) degrees, a division of 3 yields 120 (360/3) degrees. Thus if two planets are either 90 or 120 degrees apart, they form a relation with each other. In astrology these relations are called "aspects".
Bradley employed the circle divisions of 1, 2, 3, 4 and 6 for his formula, leading to aspects of 360, 180, 120, 90 and 60 degrees respectively. Bradley did not include the division of 5 in his formula since the result 72 (360/5) is not a multiple of 10. In fact by choosing only these 5 aspects Bradley was in good company.
Already in the years 100 - 178 AD, Claudius Ptolomaeus of Alexandria was the foremost and respected astronomer of his time. He wrote a famous book called "Tetrabiblos" in which he summarized the astrological findings of the old Chaldeans and stated the importance of these five aspects. So it happened that up to this date - the five aspects that Bradley used in his formula - are known as the "Ptolemy" aspects.

Weighing 180 events as positive or negative

Combining 36 combinations with 5 aspects yields a total of 180 (5*36) planetary events that comprise the Bradley formula. For each of these Bradley would use a wide orb of 15 degrees, but he would assign the greatest weights to those planetary pairs that were making exact aspects to each other.
Simply spoken, if there are many planets making exact aspects at the same time - the Bradley Indicator will reach a peak and a turning point in the stock market is indicated.
This is however not exactly true. Building on the theory of the musical scale and on the old astrological scriptures of Ptolomaeus and other famous astrologers, Bradley would classify some aspects as positive and other aspects as negative. All 60 and 120 aspects received positive weights and all 90 and 180 aspects received negative weights. Concerning the remaining 36 conjunctions Bradley classified each of them individually as either positive or negative. All conjunctions formed by Mars and Saturn received negative weights, because Mars and Saturn were traditionally considered the malefic planets according to the ancient scriptures. Most of the conjunctions of Venus and Jupiter received positive weights since these two planets were the traditional beneficiaries. The remaining conjunctions Bradley rated as either positive or negative according to his testing of the stock market at that time.

Rising to Fame

By constantly weighing 182 (Bradley also added the declinations of Venus and Mars into his final formula) planetary combinations in that manner Bradley hoped that his Siderograph would turn positive as stock prices rise and turn negative as stock prices fall. After more than 50 years of data we know that his happened some of the time, but not most of the time. However the turns indicated in the Bradley formula have coincided with stock market turns in such a regular fashion and with such an amazing accuracy that the Bradley indicator has reached fame and widespread acclaim beyond the narrow borders of financial astrology.


THE BRADLEY IS A MEASURE OF PLANETARY GEOMETRY

Why does the Bradley work ? Because it is a mathematical and hence objective measure of planetary geometry. Let me explain this. The Bradley will reach a turning point if many of the 180 planetary aspects are becoming exact at the same time. I have convinced myself that neutralizing the effects of the Venus and Mars declinations will NOT change the turning points in the Bradley formula, although this will alter the SHAPE of the Siderograph.
Strictly spoken the Bradley will reach a high if many trines (120) and sextiles (60) and some conjunctions (0) become exact at the same time and will reach a low if many oppositions (180) and squares (90) and some conjunctions become exact at the same time. However many aspects becoming exact at the same time will always tend to create a special form of planetary geometry. And that is why the Bradley indicator is a mathematical measure of planetary geometry and the success of the Bradley proves that planetary geometry works in forecasting turns in the stock market.

Even if the Bradley has a great record of signaling long term stock market turns, at certain times it has failed completely to signal an important turn. Why ? Because sometimes the positive and negative weights in the Bradley formula will cancel each other out and the Bradley will NOT indicate a turn, even if the geometry of the planets would indicate otherwise.

2
  • Post #11,431
  • Quote
  • May 28, 2020 5:57pm May 28, 2020 5:57pm
  •  jfvelas
  • | Joined Aug 2008 | Status: Member | 25 Posts
Quoting jnevins
Disliked
{quote} Actually no... I just pointed out that ingress for George, F.G. I have not been able to act proactively on these transits... they are interesting to me to look at them in hindsight.
Ignored
Thanks jnevins. My demo account expired on timing solution and as promised the projection line doesn´t work at all.
  • Post #11,432
  • Quote
  • May 29, 2020 11:06pm May 29, 2020 11:06pm
  •  jnevins
  • Joined Feb 2007 | Status: Member | 2,098 Posts
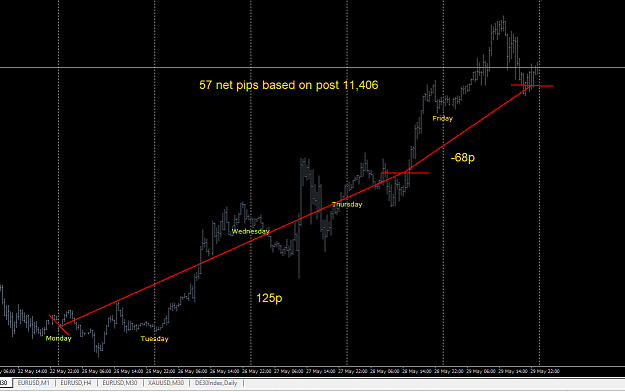
End of the week recap.... The market kept heading higher after my expected turn. Nevertheless, there was a net gain of 57 pips. Prediction was posted May 22.
Attached Image (click to enlarge)
Click to Enlarge

Name: Capture.PNG
Size: 34 KB
2
  • Post #11,433
  • Quote
  • May 29, 2020 11:38pm May 29, 2020 11:38pm
  •  jnevins
  • Joined Feb 2007 | Status: Member | 2,098 Posts
Outlook for next week...

Down week in store... keep an eye out for a CIT around 02:15 Friday, UTC+3

Dk blue line is Moon synodic cycle, 1/5th harmonic 50% sm orb. Red is Harmonic box distillation of the Spectrum peaks.
Attached Image (click to enlarge)
Click to Enlarge

Name: Capture.PNG
Size: 24 KB
5
  • Post #11,434
  • Quote
  • May 30, 2020 4:43am May 30, 2020 4:43am
  •  enoeraew
  • | Joined Dec 2014 | Status: Member | 47 Posts
Quoting jnevins
Disliked
End of the week recap.... The market kept heading higher after my expected turn. Nevertheless, there was a net gain of 57 pips. Prediction was posted May 22. {image}
Ignored

I had another good week, with your chart in mind racked up 101 pips. I still have my sell over the weekend so I like the next projection.

Thank you Mr Jnevins and and other traders who take the time to educate us new and old traders to your way of looking at the EU.

Have a great weekend all
  • Post #11,435
  • Quote
  • May 30, 2020 7:48am May 30, 2020 7:48am
  •  fx2022
  • | Additional Username | Joined Mar 2020 | 32 Posts
Quoting jnevins
Disliked
Outlook for next week... Down week in store... keep an eye out for a CIT around 02:15 Friday, UTC+3 Dk blue line is Moon synodic cycle, 1/5th harmonic 50% sm orb. Red is Harmonic box distillation of the Spectrum peaks. {image}
Ignored
would you mind running the similarity function for this week. thanks
  • Post #11,436
  • Quote
  • May 30, 2020 10:37am May 30, 2020 10:37am
  •  Forensic
  • | Joined Feb 2020 | Status: Member | 90 Posts
Quoting jnevins
Disliked
Outlook for next week... Down week in store... keep an eye out for a CIT around 02:15 Friday, UTC+3 Dk blue line is Moon synodic cycle, 1/5th harmonic 50% sm orb. Red is Harmonic box distillation of the Spectrum peaks. {image}
Ignored
Thanks for this. Matches my prediction.
  • Post #11,437
  • Quote
  • May 30, 2020 10:52am May 30, 2020 10:52am
  •  jnevins
  • Joined Feb 2007 | Status: Member | 2,098 Posts
Quoting enoeraew
Disliked
{quote} I had another good week, with your chart in mind racked up 101 pips. I still have my sell over the weekend so I like the next projection. Thank you Mr Jnevins and and other traders who take the time to educate us new and old traders to your way of looking at the EU. Have a great weekend all
Ignored
Thanks enoeraew, one still has to be on their toes to protect you gains with regular TA... this way of looking at the EU helps me to feel more confident about those entries and exits...
  • Post #11,438
  • Quote
  • May 30, 2020 11:00am May 30, 2020 11:00am
  •  jnevins
  • Joined Feb 2007 | Status: Member | 2,098 Posts
Quoting fx2022
Disliked
{quote} would you mind running the similarity function for this week. thanks
Ignored
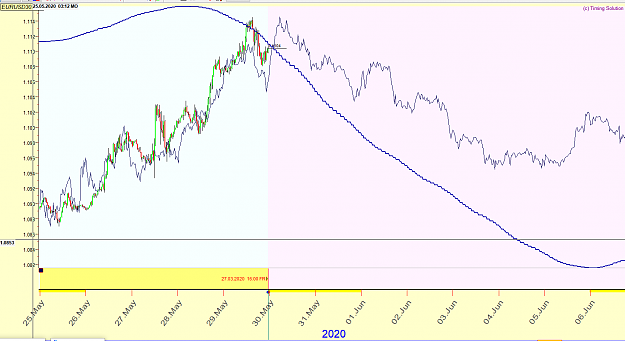
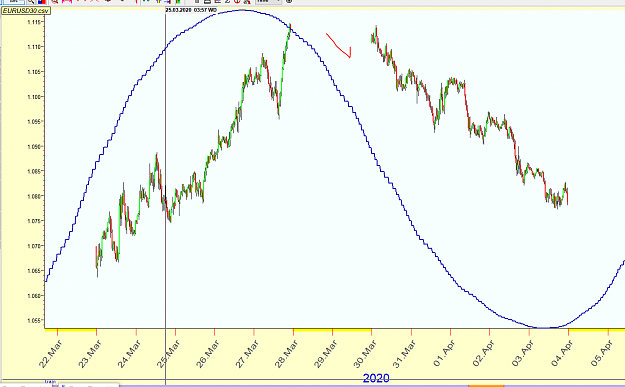
Sure thing.. here you go... the line is price action from the week of Friday March 27, 2020 and the subsequent week.

The second image is a look at those 2 weeks, March 23 - April 3.
Attached Images (click to enlarge)
Click to Enlarge

Name: Capture.PNG
Size: 60 KB Click to Enlarge

Name: Capture1.PNG
Size: 59 KB
2
  • Post #11,439
  • Quote
  • May 31, 2020 12:58pm May 31, 2020 12:58pm
  •  F.g
  • Joined Aug 2016 | Status: Member | 3,775 Posts | Online Now
What worries me with this week's prediction is the CIT I am expecting on June 2 and 3 .....

Sun 135* Jupiter
Venus sq. Mars
Sun conj. Venus

  • Post #11,440
  • Quote
  • May 31, 2020 1:52pm May 31, 2020 1:52pm
  •  Forensic
  • | Joined Feb 2020 | Status: Member | 90 Posts
Quoting Forensic
Disliked
{quote} Thanks for this. Matches my prediction.
Ignored
However, my only hesitation is that, from just observing price action and time cycles, I feel a new extended upward trend is about to commence. So the next phase may be upwards. We shall see.
  • Interactive Trading
  • /
  • Planetary Cycles Trading (EUR/USD)
  • Reply to Thread
    • 1 570571Page 572573574 605
    • 1 Page 572 605
4 traders viewing now, 1 is a member:
F.g
  • More
Top of Page
  • Facebook
  • Twitter
About FF
  • Mission
  • Products
  • User Guide
  • Media Kit
  • Blog
  • Contact
FF Products
  • Forums
  • Trades
  • Calendar
  • News
  • Market
  • Brokers
  • Trade Explorer
FF Website
  • Homepage
  • Search
  • Members
  • Report a Bug
Follow FF
  • Facebook
  • Twitter

FF Sister Sites:

  • Metals Mine
  • Energy EXCH
  • Crypto Craft

Forex Factory® is a brand of Fair Economy, Inc.

Terms of Service / ©2021