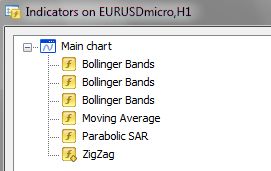
All you need is these indicators... Parabolic SAR and Zig-Zag at default settings.
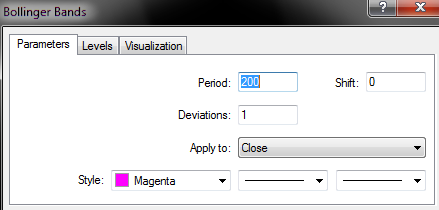
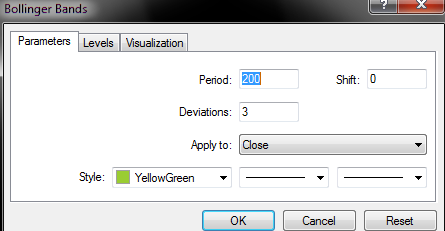
I'm using period 200 just because I like how price reacts when touching it.
1st Bollinger Band setings
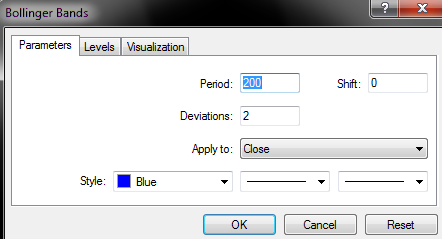
2nd Bollinger Band setings
3rd Bollinger Band setings
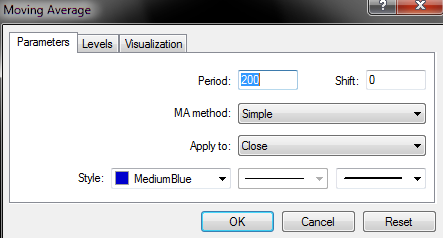
Simple Moving Average
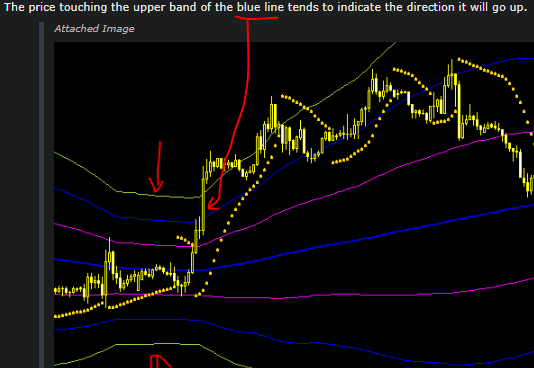
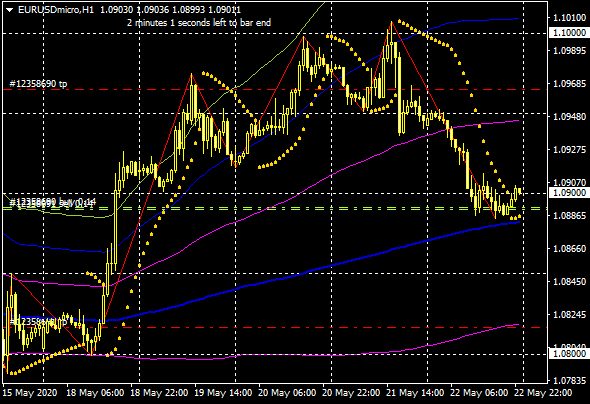
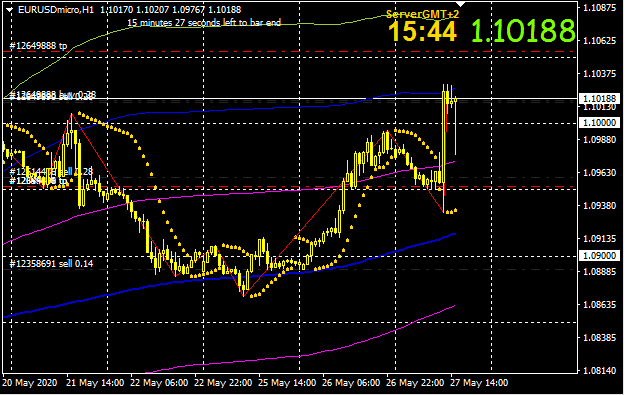
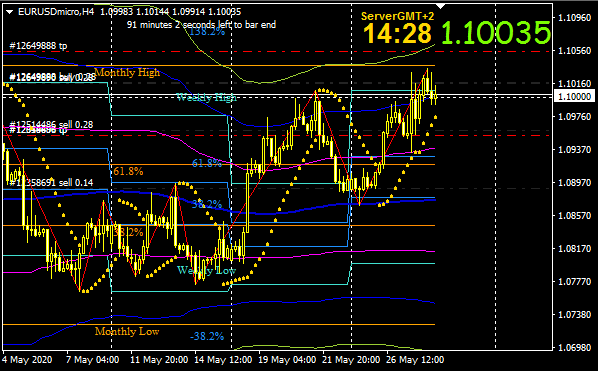
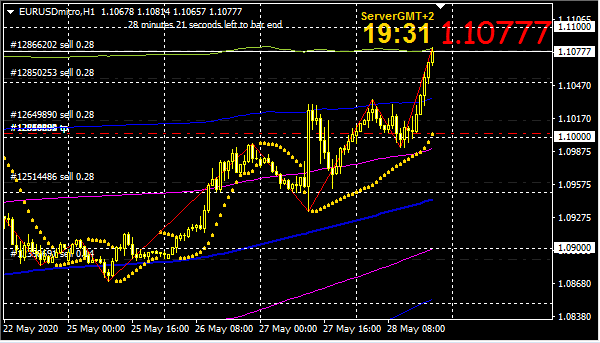
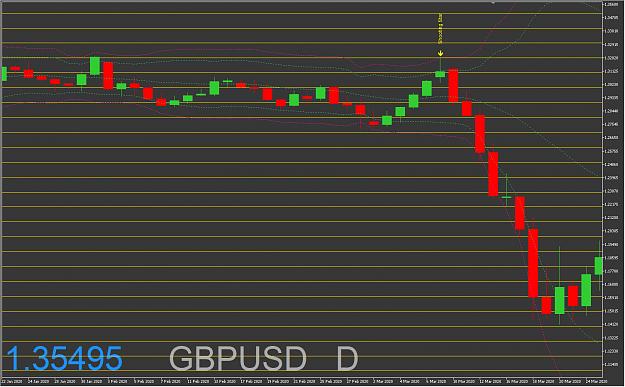
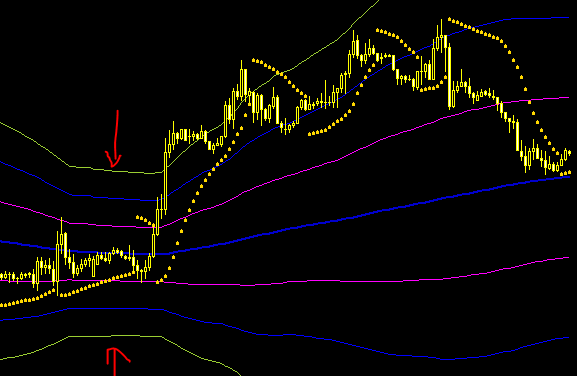
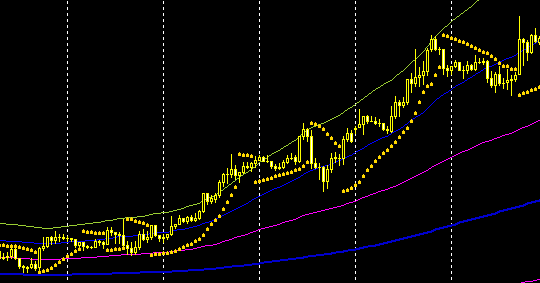
Shown Below, when Bollinger Band is compressed... it signals a breakout is near.
The best we can do here is to wait for the price to breakout 1st.
The price touching the upper band of the blue line tends to indicate the direction it will go up.
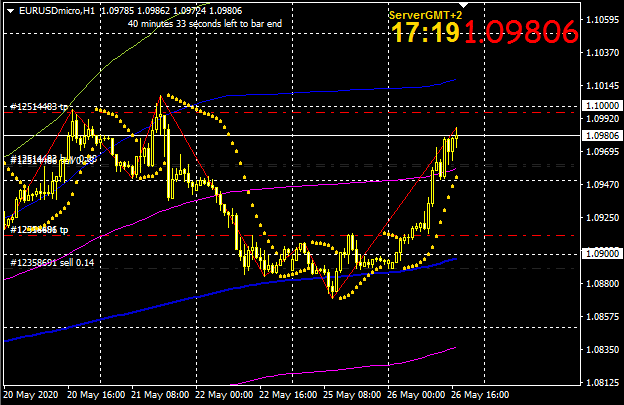
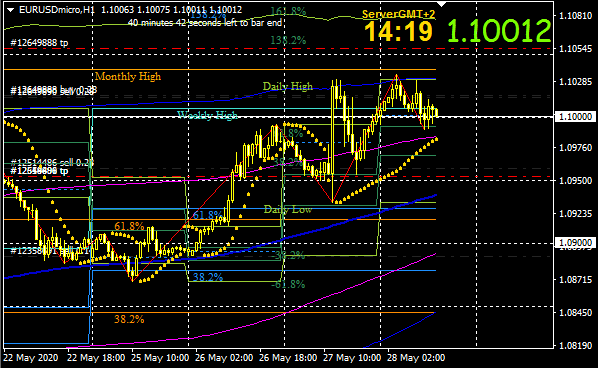
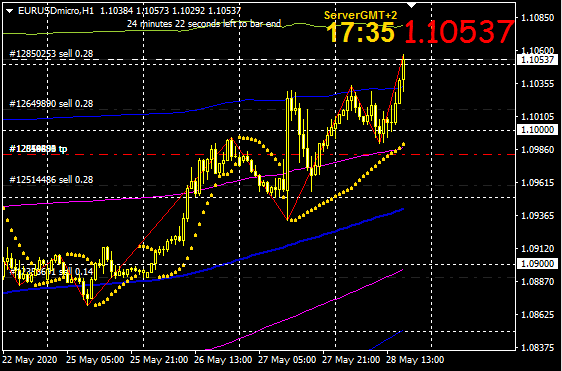
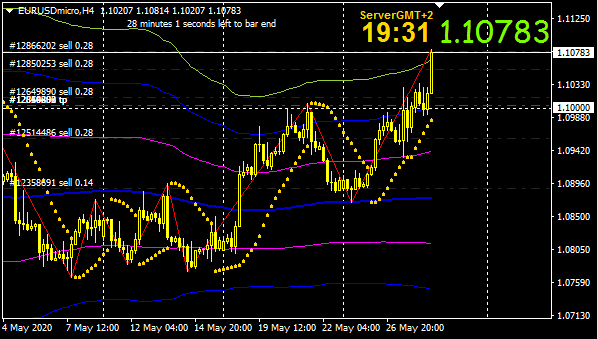
Show below, as long as price above the pink line... direction is trending up.
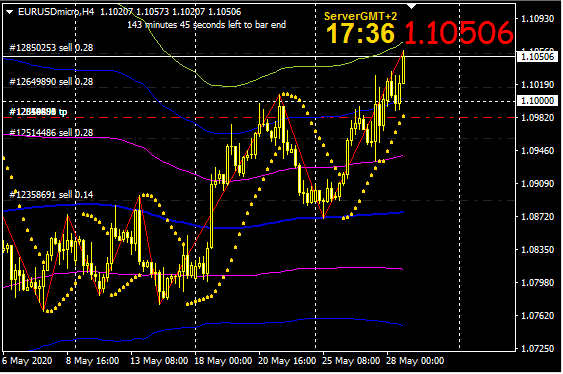
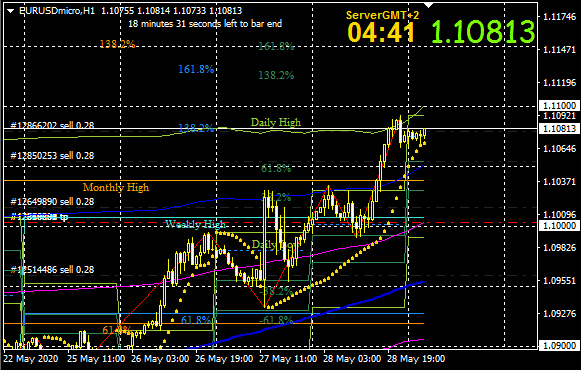
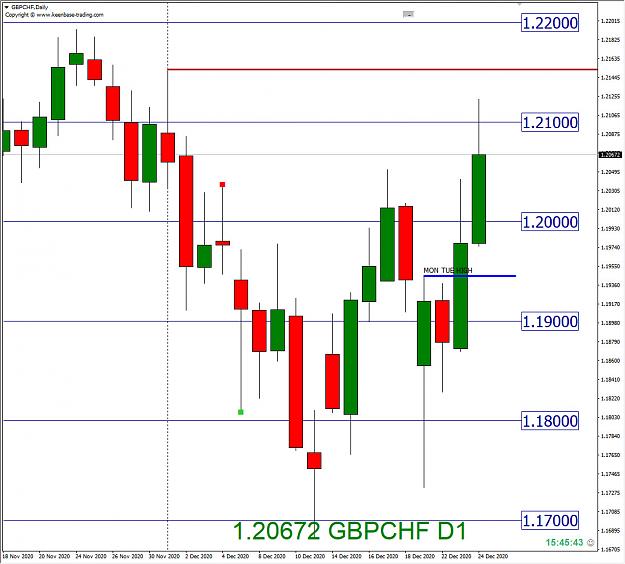
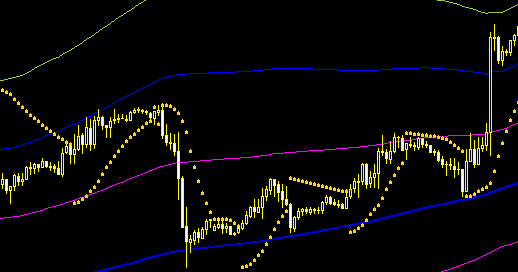
Shown below, Middle Bollinger Band - blue line will act as a strong support if the price is above it and act as resistance if the price below it.
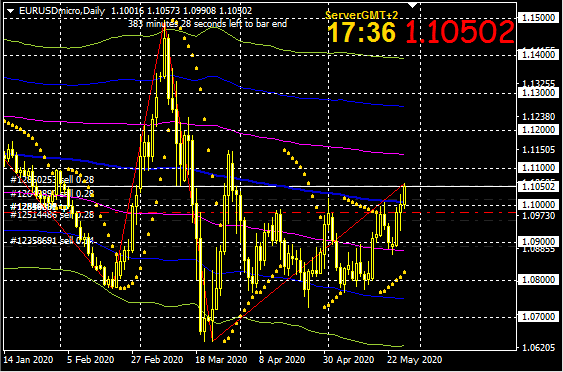
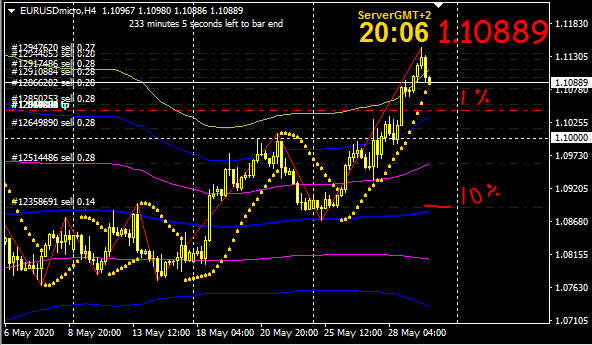
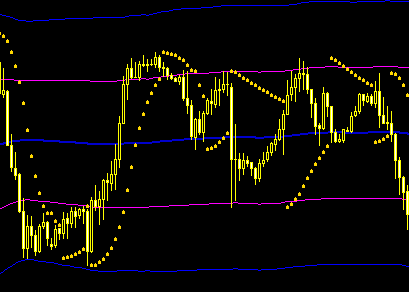
Shown below, when the market trend is range.
Price tends to bounce between upper pink and lower pink.
The middle line usually flat when the market is range.
I simply can't attach everything. But this is a good start.
I use Parabolic SAR just to substitute it with Zig-Zag on android MT4/MT5.
Both are great at detecting recent high and low swing.
I usually use H1 and H4... but you can use any timeframe.
The best way to use this triple Bollinger Band is to use it as a support and resistance line.
The price usually bounces back when touching it...
and the line also gives a clue about how much range in pips the price can move next.
Remember, the price tends to move inside the band.
That's all... Good luck.
I'm using period 200 just because I like how price reacts when touching it.
Attached Image
1st Bollinger Band setings
Attached Image
2nd Bollinger Band setings
Attached Image
3rd Bollinger Band setings
Attached Image
Simple Moving Average
Attached Image
Shown Below, when Bollinger Band is compressed... it signals a breakout is near.
The best we can do here is to wait for the price to breakout 1st.
The price touching the upper band of the blue line tends to indicate the direction it will go up.
Attached Image
Show below, as long as price above the pink line... direction is trending up.
Attached Image
Shown below, Middle Bollinger Band - blue line will act as a strong support if the price is above it and act as resistance if the price below it.
Attached Image
Shown below, when the market trend is range.
Price tends to bounce between upper pink and lower pink.
The middle line usually flat when the market is range.
Attached Image
I simply can't attach everything. But this is a good start.
I use Parabolic SAR just to substitute it with Zig-Zag on android MT4/MT5.
Both are great at detecting recent high and low swing.
I usually use H1 and H4... but you can use any timeframe.
The best way to use this triple Bollinger Band is to use it as a support and resistance line.
The price usually bounces back when touching it...
and the line also gives a clue about how much range in pips the price can move next.
Remember, the price tends to move inside the band.
That's all... Good luck.