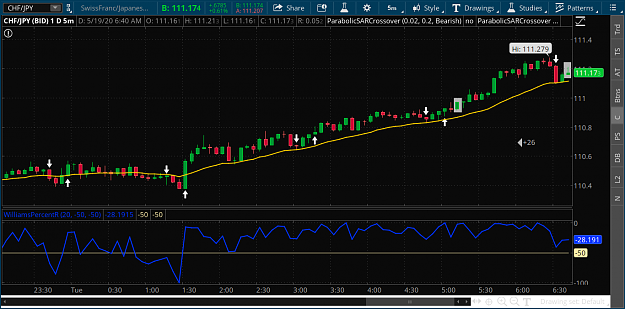
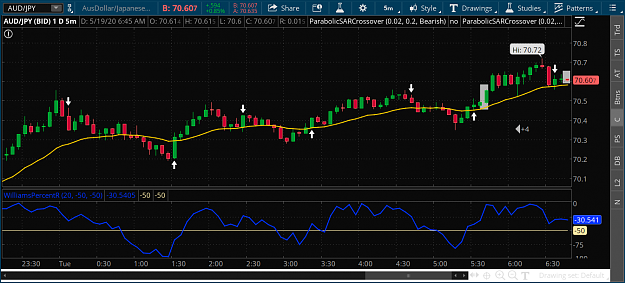
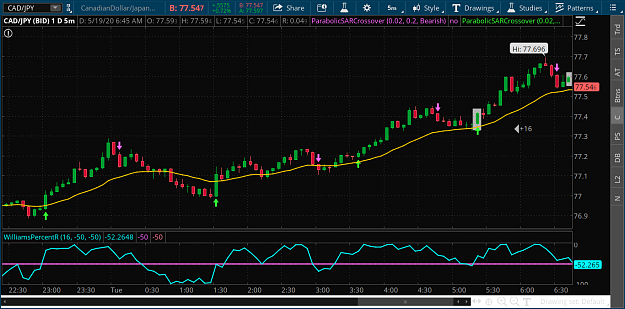
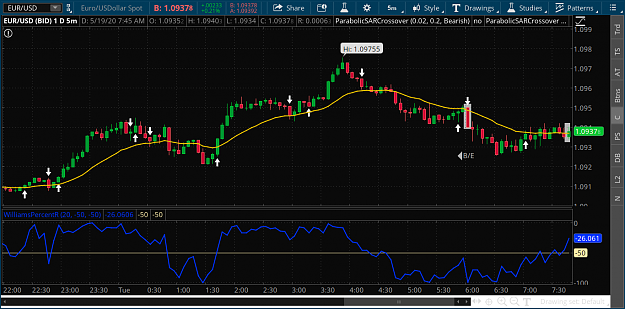
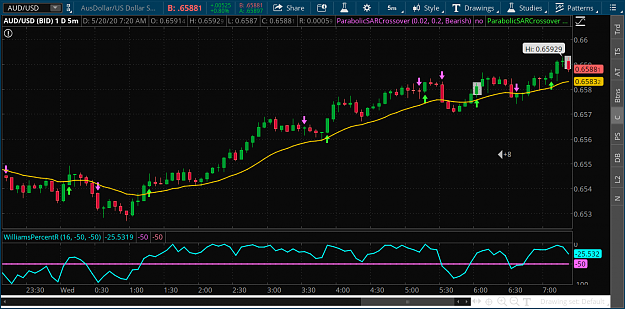
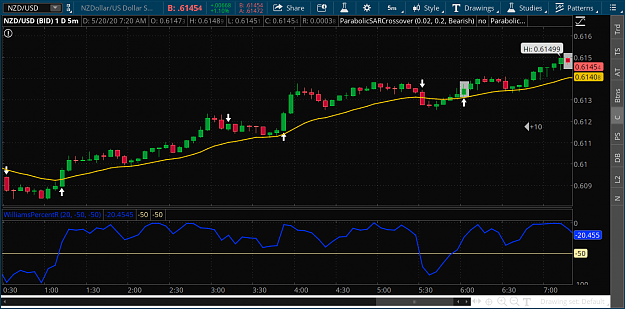
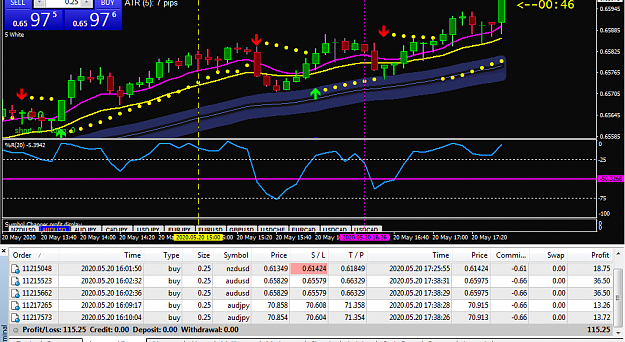
DislikedOk, in general a pretty easy day, trending pairs, basically telling you to short against USD and JPY. Just needed to find good entry points. {image} {image} {image} {image}Ignored
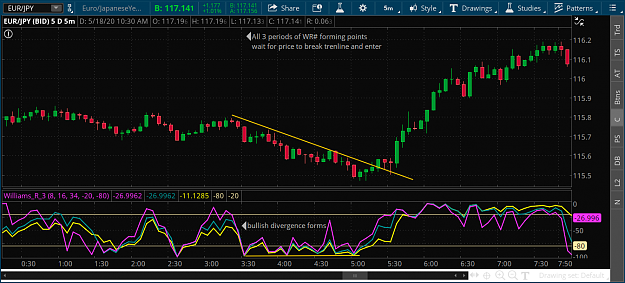
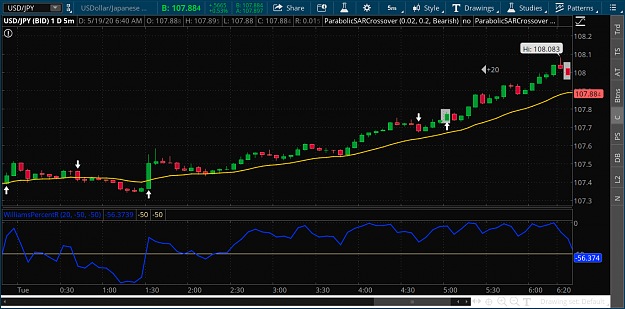
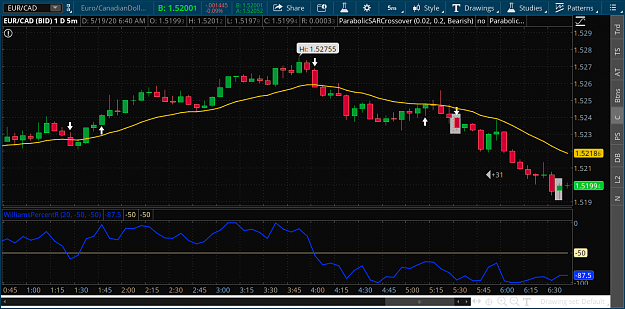
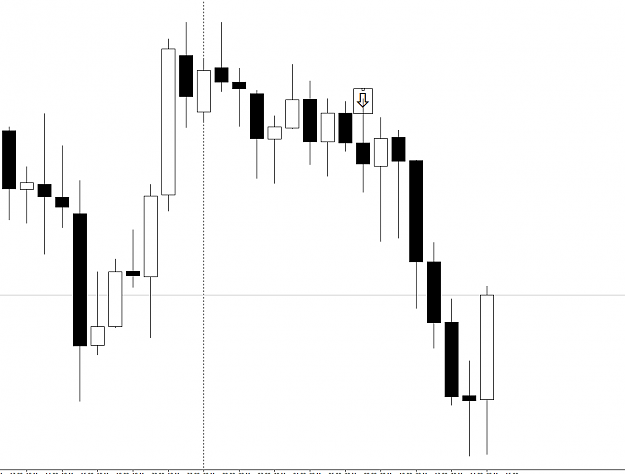
 Williams%R, SAR X-over 15 minute candles
- #443
- Edited 10:32am May 18, 2020 10:20am | Edited 10:32am
- Joined Jul 2012 | Status: Trader | 1,880 Posts