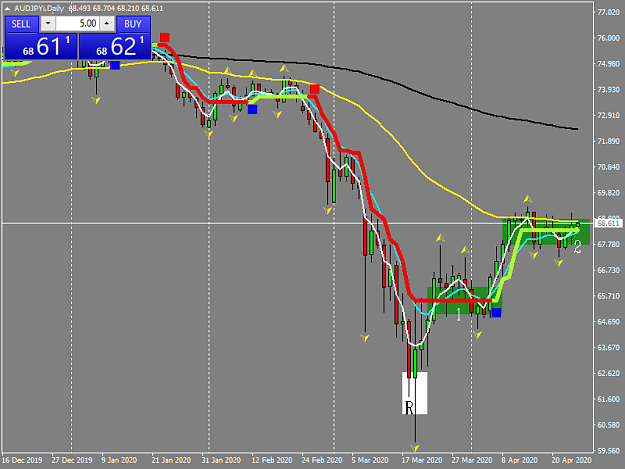
Disliked{quote} AUDCAD on 4h, I believe this is a good example of a fractal, in the red circle you can see the low marked in orange and the most recent candle breaking the previous high. From what I understand AUDCAD will continue to rise for a while. Please correct me if im wrong PC! {image}Ignored
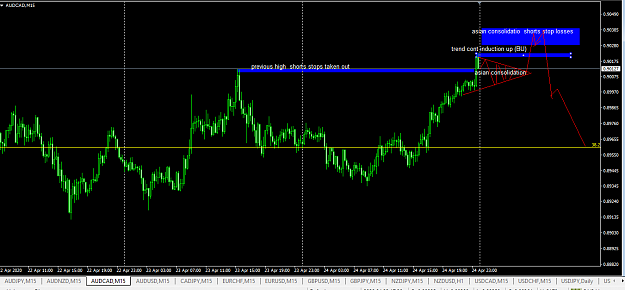
Sidney, i am currently going through my charts in prep for tomorrow. Starting with AUDCAD here is what i see probably happening after Asian opening, creation of consolidation forming that wedge. Already the 1st foundations of it are formed, and through to London open, thereabouts, an impulse move of 1-3 candles on 15mins taking it up inducing the buying trend and breakout traders along with it, but only as far as the stop losses accumulated during the asian and the reversal traders. think about this one carefully cos if you see that asian pattern and the follow on BO, i know i will be watching and taking it down with virtually zero drawdown. The only thing going for it long is that the open positions are 86% short, but thats open positions with on average 20pips stop losses, so that limits upward possible rang to around 20pips above the previous high, so that pretty much ties in with my analysis mentioned earlier. trade safe, trade with max probabilities.
Attached Image (click to enlarge)
6