• Home
  • Forums
  • Trades
  • News
  • Calendar
  • Market
  • Brokers
  • Login
  • Join
  • User/Email: Password:
  • 1:54am
Menu
  • Forums
  • Trades
  • News
  • Calendar
  • Market
  • Brokers
  • Login
  • Join
  • 1:54am
Sister Sites
  • Metals Mine
  • Energy EXCH
  • Crypto Craft

Options

Bookmark Thread

First Page First Unread Last Page Last Post

Print Thread

Similar Threads

Break Out + Pull Back & Pure Break Outs 58 replies

BB break + trendline break 23 replies

Looking for L > Break High Break Low Indicator 1 reply

A break below - A Break Above Question 1 reply

  • Trading Journals
  • /
  • Reply to Thread
  • Subscribe
  • 4,472
Attachments: The Jail Break System
Exit Attachments

The Jail Break System

  • Last Post
  •  
  • Page 1 23456 795
  • Page 1 2 795
  •  
  • Post #1
  • Quote
  • First Post: Edited Jun 6, 2020 12:06pm Sep 8, 2019 7:06pm | Edited Jun 6, 2020 12:06pm
  •  PokerChip
  • Joined Mar 2018 | Status: Member | 4,348 Posts
This is a forex system " The Jail Break System " that I started working on in June of 2010 after losing exactly $330,000 dollars from multiple forex accounts that begin in 2008. I reloaded my 3 accounts several times until my wife told me if I reload my accounts again she would leave me. Right then I started looking for a better way to trade forex. In 2008 I thought I knew enough to make a profit daily in forex. Little did I know I knew nothing about how to trade foreign currency. I burned through $330,000 in 17 months. I've been back trading full time since June of 2011 and I've got all of my money back as of March 2017. Now I'm taking all the money that I can from the banks one trade at a time using the jail break system.

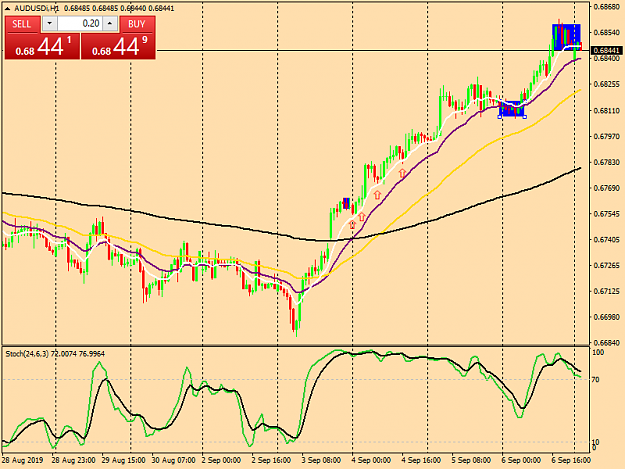
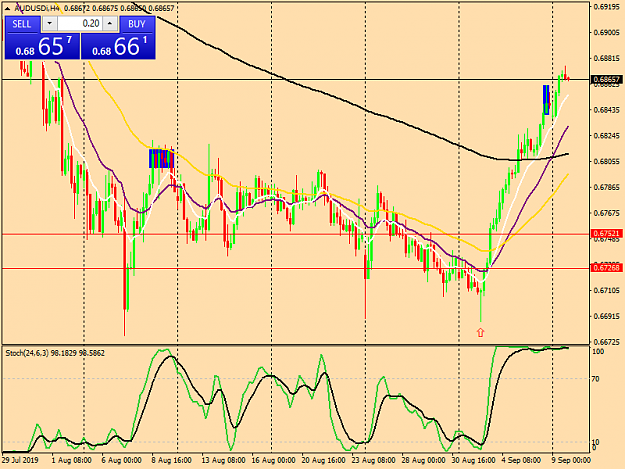
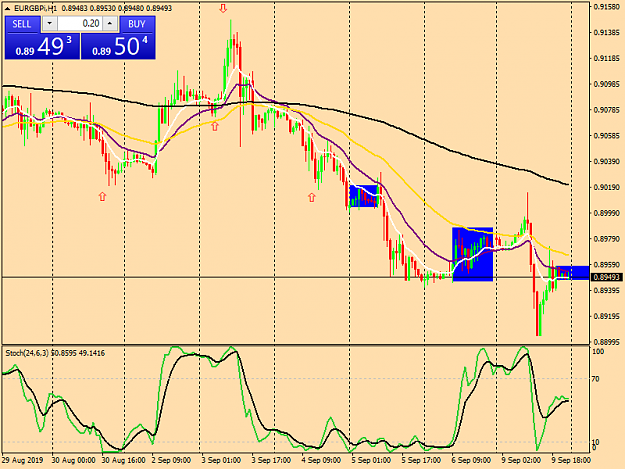
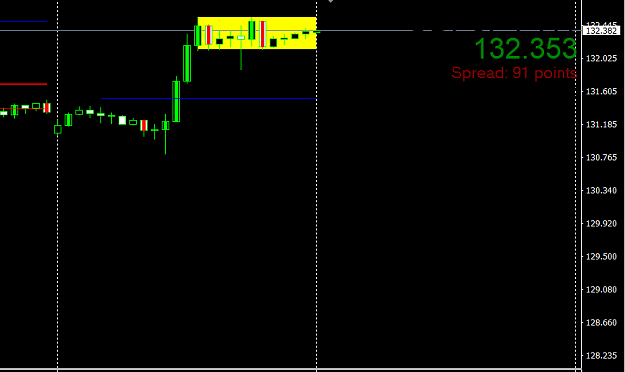
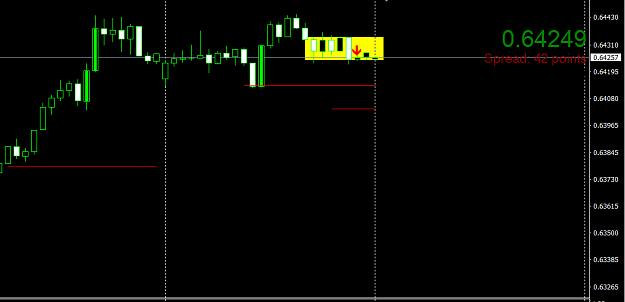
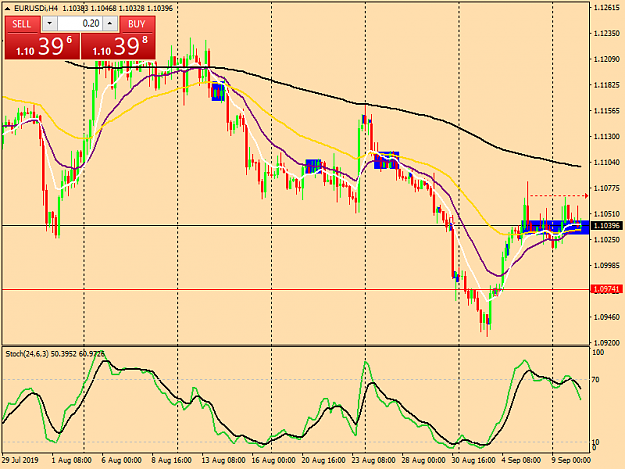
(This is how I trade). I wait until I see what I call railroad tracks, this is when the pair contracts and runs horizontal for several candles. When the pair breaks out of the blue box area. I use the 4 hour chart to tell me what direction the pair is headed and I use the 1 hour chart for the entry. The blue box area is the beginning of a cycle, then the second phase is the jail break. If the four hour chart tells you the pair is going down then you wait for the jail break to happen. A lot of times the pair will make a fake out move to the wrong direction. You need to wait until the fake out is over then enter the market. Remember look at the four hour chart before going to the 1 hour chart to make a entry. The contraction area can be seen on any chart from one minute to the monthly. When you make your entry you'll be in the third part of the cycle this is when you'll make your profit. (The third part of the cycle will not end until the pair starts to contract) then you'll be able to put this in a box and start the cycle all over again like you see on my chart.

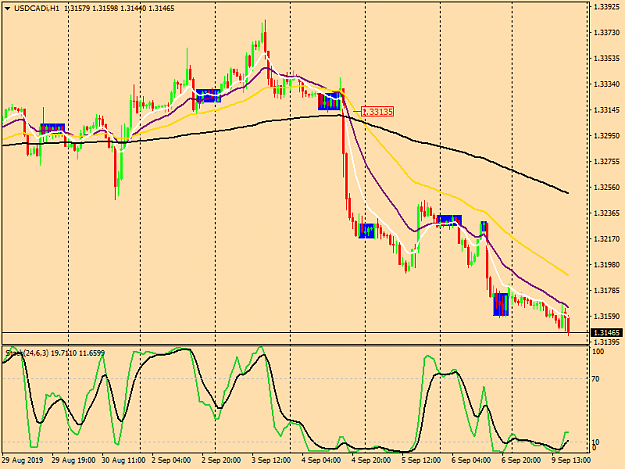
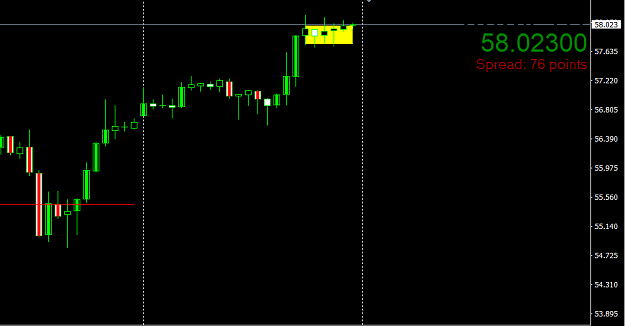
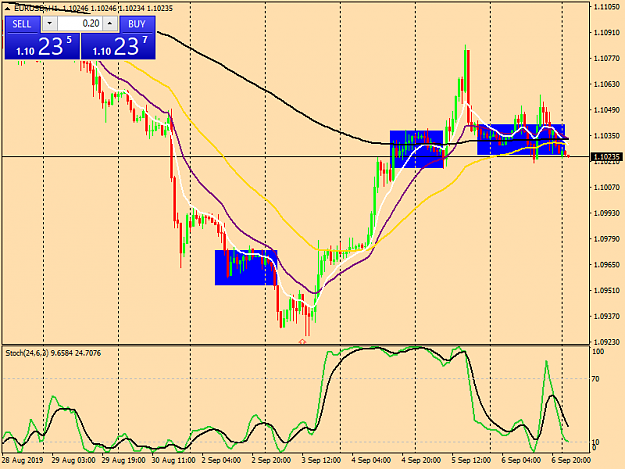
Look for a " M " or " W " inside the blue box. If this was a sell you can see the market manipulators whipsawed these oil traders up and down then they made the move out of the box to the lower side.

When you use with the 4 hour chart or the 1 hour chart these time frames are very powerful and they tell you where the market is going on any pair or even crude oil.

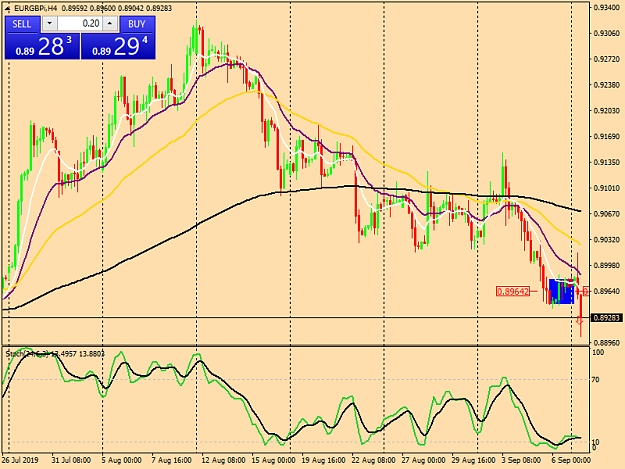
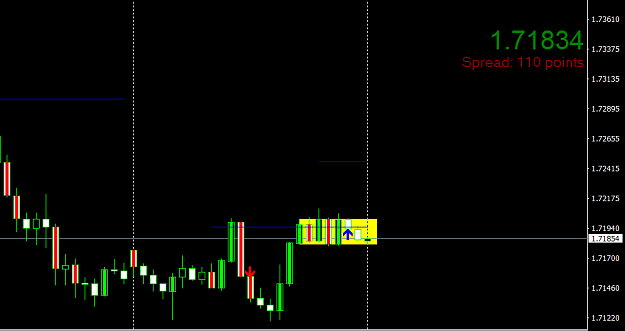
Note: These market manipulators can't stay in this box forever, they have to move out of the box and make the big money when they exit the box. So you have to be patient and wait for they're move out of the box. Remember there are 3 phases. The 1st phase is the contracted small horizontal candles, the 2nd phase is the whipsaw effect of trapping traders, the 3rd phase is the exit from the box where you make the entry to buy or sell and this is when you make the profit. And this 3rd phase doesn't stop until the pair or crude oil goes back into contracting small horizontal candles. (This isn't a lagging indicator, this is a real time indicator.)

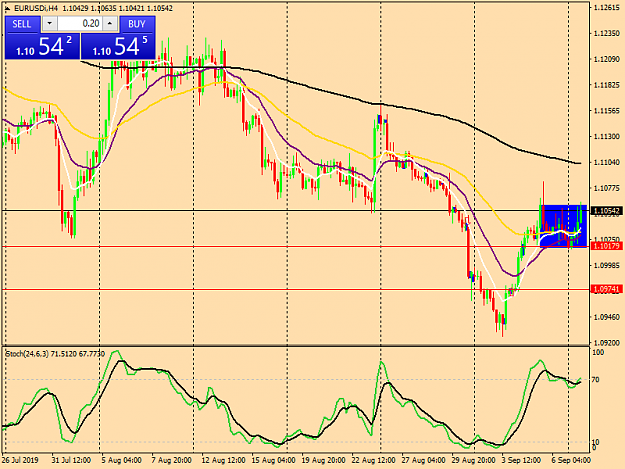
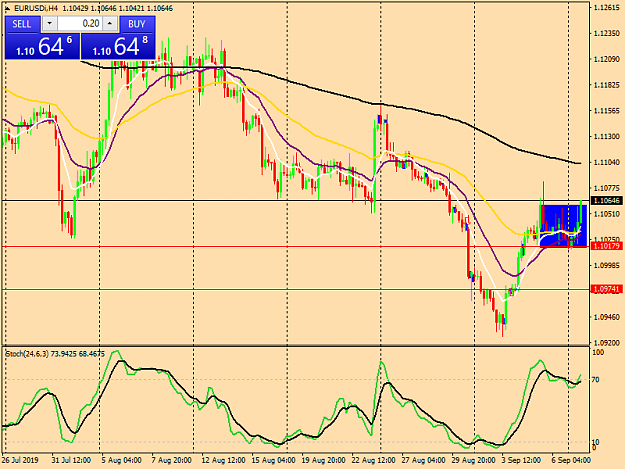
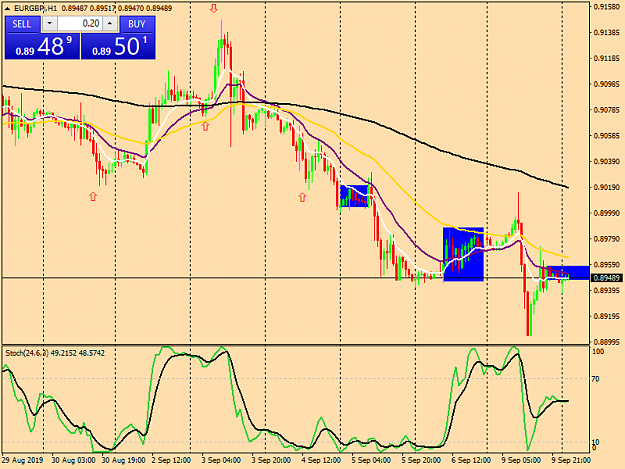
As you can see the EUR/USD chart below a red candle has exited the blue box and heading lower. This would be the very best place to short the Euro.

I've included a PDF file for traders that are interested in learning the jail break system.

Very important note at all: I want to remind traders here or that are going to be coming here on this thread that when traders are open about their trades this is not a indicator to buy or sell based solely on another traders thoughts. Please keep this in you're thoughts if and when you decide to trade. Thank you for listening.
Attached Image (click to enlarge)
Click to Enlarge

Name: eurusdi-h1-tw-corp-eur-usd-chart-today.png
Size: 42 KB
Attached File
File Type: pdf The jail break system.pdf   24 KB | 4 downloads | Uploaded Nov 24, 2019 1:20pm
Patience & Discipline
  • Post #2
  • Quote
  • Sep 8, 2019 7:25pm Sep 8, 2019 7:25pm
  •  PokerChip
  • Joined Mar 2018 | Status: Member | 4,348 Posts
Here is another example of a red candle leaving the blue box in the pair AUD/USD.
Attached Image (click to enlarge)
Click to Enlarge

Name: audusdi-h1-tw-corp-aud-usd-chart-today.png
Size: 41 KB
Patience & Discipline
1
5
  • Post #3
  • Quote
  • Sep 9, 2019 8:31am Sep 9, 2019 8:31am
  •  PokerChip
  • Joined Mar 2018 | Status: Member | 4,348 Posts
If you look at this 4 hour chart of the EUR/GBP from today you want to wait until the pair exits the box and then wait until the pair settles down. Normally any pair will exit the chart and make a quick move to the up side or the down side. This is the fake out move. Then it will it will settle down and show you its intended direction. You can make your entry once this has happened. It might take up to 12-24 hours for this to happen on the 4 hour chart. Draw a horizontal line or you can use a arrow in the middle of the chart. If the price settles below the middle of the 4 hour chart more than likely the price will keep on falling until a reversal comes.
Attached Image (click to enlarge)
Click to Enlarge

Name: eurgbpi-h4-tw-corp-eur-gbp-today.png
Size: 45 KB
Patience & Discipline
1
2
  • Post #4
  • Quote
  • Sep 9, 2019 10:46am Sep 9, 2019 10:46am
  •  PokerChip
  • Joined Mar 2018 | Status: Member | 4,348 Posts
Take a look at the 4 hour EUR/USD chart, I look for the pair to leave the box and move to the north.
Attached Image (click to enlarge)
Click to Enlarge

Name: eurusdi-h4-tw-corp-eur-usd-today.png
Size: 44 KB
Patience & Discipline
1
1
  • Post #5
  • Quote
  • Sep 9, 2019 11:39am Sep 9, 2019 11:39am
  •  PokerChip
  • Joined Mar 2018 | Status: Member | 4,348 Posts
Looking at the chart the very best entry would have been right after it left the box heading south.
Attached Image (click to enlarge)
Click to Enlarge

Name: usdcadi-h1-tw-corp-usd-cad-2.png
Size: 40 KB
Patience & Discipline
1
1
  • Post #6
  • Quote
  • Edited at 1:02pm Sep 9, 2019 11:46am | Edited at 1:02pm
  •  PokerChip
  • Joined Mar 2018 | Status: Member | 4,348 Posts
Here is a updated chart on the EUR/USD as you can see the candle has moved out of the box and is heading north. After a reversal this is the very best price for a buy entry.
Attached Image (click to enlarge)
Click to Enlarge

Name: eurusdi-h4-tw-corp-eur-usd.png
Size: 44 KB
Patience & Discipline
 
2
  • Post #7
  • Quote
  • Edited at 1:25pm Sep 9, 2019 12:19pm | Edited at 1:25pm
  •  PokerChip
  • Joined Mar 2018 | Status: Member | 4,348 Posts
Remember when you see quick moves to the up side or the down side these are fake out moves by the banks trying to pull retail traders into a trade. The slow steady move to the up side or the down side is the right direction.

When you are looking for a pair to make a trade, be sure to always look for the railroad tracks, these railroad tracks are telling you a change is going to happen. You want to be on a 4 hour chart to see these railroad tracks. The reason for this is the 4 hour chart is the authority over any other chart in lower time frames. I'll post a 4 hour chart of railroad tracks so you can see what to look for, I'll put a box around them.

These are the railroad tracks that you will be looking for on this AUD/USD 4 hour chart.
Attached Image (click to enlarge)
Click to Enlarge

Name: audusdi-h4-tw-corp-aud-usd-2.png
Size: 48 KB
Patience & Discipline
1
4
  • Post #8
  • Quote
  • Sep 9, 2019 4:44pm Sep 9, 2019 4:44pm
  •  PokerChip
  • Joined Mar 2018 | Status: Member | 4,348 Posts
Right now the EUR/GBP H1 chart is the contracting phase which is the 1st leg of the cycle. This pair will run horizontal for hours until it breaks out of the box into the 2nd phase of the cycle it will be ranging up and down most likely until it goes into the 3rd leg of the cycle which is where you make the profit. You want to ride the pair in this 3rd leg of the cycle until you have enough pips to satisfy you, what ever that is.
Attached Image (click to enlarge)
Click to Enlarge

Name: eurgbpi-h1-tw-corp-eur-gbp.png
Size: 44 KB
Patience & Discipline
1
1
  • Post #9
  • Quote
  • Sep 9, 2019 5:12pm Sep 9, 2019 5:12pm
  •  binnie
  • | Joined Dec 2010 | Status: invisible | 847 Posts
Hi PC - I have changed all my charts to look at the H1 . Can you comment if these are in line with what you are thinking ? Cheers.
Ignore small red/blue lines or any arrows. These are just part of the Momentum Candles I am trying out.
Attached Image (click to enlarge)
Click to Enlarge

Name: EN_H1_Railtracks_10sep.png
Size: 15 KB

Attached Image (click to enlarge)
Click to Enlarge

Name: GJ_H1_railtrack_10sep.png
Size: 15 KB

Attached Image (click to enlarge)
Click to Enlarge

Name: NU_H1_traintrack_10sep.png
Size: 18 KB

Attached Image (click to enlarge)
Click to Enlarge

Name: Oil_h1_Traintrack_10sep.png
Size: 15 KB
 
 
  • Post #10
  • Quote
  • Sep 9, 2019 5:17pm Sep 9, 2019 5:17pm
  •  PokerChip
  • Joined Mar 2018 | Status: Member | 4,348 Posts
Quoting binnie
Disliked
Hi PC - I have changed all my charts to look at the H1 . Can you comment if these are in line with what you are thinking ? Cheers. Ignore small red/blue lines or any arrows. These are just part of the Momentum Candles I am trying out. {image} {image} {image} {image}
Ignored
Binnie,
The charts look good. That's what exactly what you want. Now just watch the chart and you'll catch on what the market manipulators do. Were in the 1st leg of the cycle. Then when the pairs exit the box will be in the 2nd leg of the cycle, then when they figure out what direction they want to take these pairs will be in the 3rd leg and that's when we hitch a ride with the banks, because that's who's running the show. I'm going to post some more charts later tonight.
Patience & Discipline
 
8
  • Post #11
  • Quote
  • Edited at 6:13pm Sep 9, 2019 5:24pm | Edited at 6:13pm
  •  PokerChip
  • Joined Mar 2018 | Status: Member | 4,348 Posts
EUR/GBP updated chart.

Note: If you have made a trade using a 4 hour chart and lets say you sold a pair, any pair for that matter. And when you executed that trade it was on the 15 minute chart. From that point on if you decide that you want to make another trade always remember this, " if the box is above the price you always want to be a seller ". " If the box is below the price you want to be a buyer ". You never want to go against the market you always want to go with the market.
Attached Image (click to enlarge)
Click to Enlarge

Name: eurgbpi-h1-tw-corp-updated-eur-gbp-chart 2.png
Size: 44 KB
Patience & Discipline
 
2
  • Post #12
  • Quote
  • Sep 9, 2019 6:16pm Sep 9, 2019 6:16pm
  •  Northumbrian
  • | Joined Sep 2017 | Status: Member | 78 Posts
Good evening Poker Chip.

I'm from the UK so I'm 5 hours in front.

I have been looking into your strategy and have decided to give it a go.

I have been watching EURUSD 4hour/1hour time frame all day today and now it is night and expect things to slow down perhaps until 8.00am BST?

I have not entered in to a trade yet as price has not broken through the rectangle yet. Stage 2 is when price breaks through, and stage 3 is when it has committed to this direction on 15 minute TF and I hitch a ride?

I have tried to down load a clip but it is saying I have to shorten it to 100,0000 characters long?
 
 
  • Post #13
  • Quote
  • Sep 9, 2019 6:42pm Sep 9, 2019 6:42pm
  •  PokerChip
  • Joined Mar 2018 | Status: Member | 4,348 Posts
6:41 PM UPDATE
Attached Image (click to enlarge)
Click to Enlarge

Name: eurgbpi-h1-tw-corp-eur-gbp-update-6-41pm.png
Size: 43 KB
Patience & Discipline
 
1
  • Post #14
  • Quote
  • Sep 9, 2019 7:59pm Sep 9, 2019 7:59pm
  •  PokerChip
  • Joined Mar 2018 | Status: Member | 4,348 Posts
EUR/GBP 7:57PM UPDATE
Attached Image (click to enlarge)
Click to Enlarge

Name: eurgbpi-h1-tw-corp-eur-gbp-7-58-pm-update.png
Size: 44 KB
Patience & Discipline
 
1
  • Post #15
  • Quote
  • Sep 10, 2019 4:01am Sep 10, 2019 4:01am
  •  Northumbrian
  • | Joined Sep 2017 | Status: Member | 78 Posts
Hi Poker Chips.

Currently watching EURUSD. Nothing breaking through over night. Rectangle top bottom properties are 1.10600 and 1.10160 respectively.

USD job news at 15.00 could push it?

Regards
 
 
  • Post #16
  • Quote
  • Sep 10, 2019 8:44am Sep 10, 2019 8:44am
  •  PokerChip
  • Joined Mar 2018 | Status: Member | 4,348 Posts
Quoting Northumbrian
Disliked
Hi Poker Chips. Currently watching EURUSD. Nothing breaking through over night. Rectangle top bottom properties are 1.10600 and 1.10160 respectively. USD job news at 15.00 could push it? Regards
Ignored
The EUR/USD is running side ways at the present time as you can see. I have it still in my box. Will just have to wait and see what direction it wants to run.
Attached Image (click to enlarge)
Click to Enlarge

Name: eurusdi-h4-tw-corp-eur-usd-8-43am.png
Size: 43 KB
Patience & Discipline
 
1
  • Post #17
  • Quote
  • Sep 10, 2019 8:46am Sep 10, 2019 8:46am
  •  PokerChip
  • Joined Mar 2018 | Status: Member | 4,348 Posts
Quoting Northumbrian
Disliked
Good evening Poker Chip. I'm from the UK so I'm 5 hours in front. I have been looking into your strategy and have decided to give it a go. I have been watching EURUSD 4hour/1hour time frame all day today and now it is night and expect things to slow down perhaps until 8.00am BST? I have not entered in to a trade yet as price has not broken through the rectangle yet. Stage 2 is when price breaks through, and stage 3 is when it has committed to this direction on 15 minute TF and I hitch a ride? I have tried to down load a clip but it is saying I have...
Ignored
I would not recommend trading the EUR/USD until it tells us which way it ways go. I have it in my box, so it's basically just sit there moving horizontal for now.
Patience & Discipline
 
1
  • Post #18
  • Quote
  • Edited at 9:08am Sep 10, 2019 8:53am | Edited at 9:08am
  •  PokerChip
  • Joined Mar 2018 | Status: Member | 4,348 Posts
EUR/GBP has broke out of the box and running south on the 4 hour chart.

I would think this pair is running south because they have traders trapped in the green candle to the left.
Attached Image (click to enlarge)
Click to Enlarge

Name: eurgbpi-h4-tw-corp-eur-gbp-8-50am.png
Size: 46 KB
Patience & Discipline
 
1
  • Post #19
  • Quote
  • Sep 10, 2019 9:25am Sep 10, 2019 9:25am
  •  Rajni1
  • | Joined Jul 2018 | Status: Member | 33 Posts
Right now EURGBP may go 100-150 pips south. I have Longs waiting there for a target of appr. 200 pips.
 
 
  • Post #20
  • Quote
  • Sep 10, 2019 9:40am Sep 10, 2019 9:40am
  •  PokerChip
  • Joined Mar 2018 | Status: Member | 4,348 Posts
If the EUR/USD does move north out of the box I'm not going to buy it until it clears 1.10595 in price.
Attached Image (click to enlarge)
Click to Enlarge

Name: eurusdi-h4-tw-corp-usd-usd-9-37am.png
Size: 43 KB
Patience & Discipline
 
 
  • Trading Journals
  • /
  • The Jail Break System
  • Reply to Thread
    • Page 1 23456 795
    • Page 1 2 795
0 traders viewing now
  • More
Top of Page
Forex Factory Blog Updated: Alerting All Members
  • Facebook
  • Twitter
About FF
  • Mission
  • Products
  • User Guide
  • Media Kit
  • Blog
  • Contact
FF Products
  • Forums
  • Trades
  • Calendar
  • News
  • Market
  • Brokers
  • Trade Explorer
FF Website
  • Homepage
  • Search
  • Members
  • Report a Bug
Follow FF
  • Facebook
  • Twitter

FF Sister Sites:

  • Metals Mine
  • Energy EXCH
  • Crypto Craft

Forex Factory® is a brand of Fair Economy, Inc.

Terms of Service / ©2022