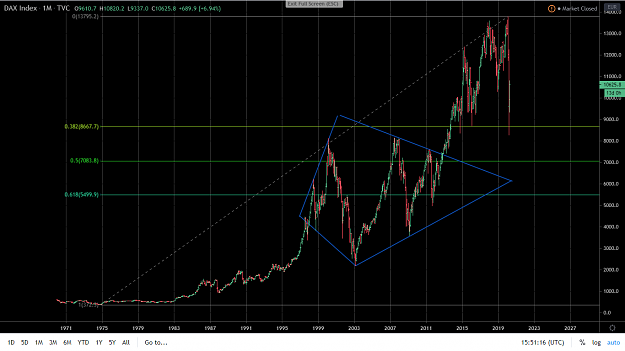
• Home
  • Forums
  • Trades
  • News
  • Calendar
  • Market
  • Brokers
  • Login
  • Join
  • User/Email: Password:
  • 5:11pm
Menu
  • Forums
  • Trades
  • News
  • Calendar
  • Market
  • Brokers
  • Login
  • Join
  • 5:11pm
Sister Sites
  • Metals Mine
  • Energy EXCH
  • Crypto Craft

Options

Bookmark Thread

First Page First Unread Last Page Last Post

Print Thread

Similar Threads

How close does a stock CFD match the underlying stock? 3 replies

Profit whether a stock goes up or down (stock + options) 3 replies

US stock market earnings results impact the Forex market 0 replies

The FX Market, the Stock Market and the end of QE2 3 replies

Will pound break 1.92? Gbp nearing it's Psyche resistance 1.92 3 replies

  • Trading Discussion
  • /
  • Reply to Thread
  • Subscribe
  • 329
Attachments: The end of the US stock market is nearing
Exit Attachments

The end of the US stock market is nearing

  • Last Post
  •  
  • 1 5960Page 616263 85
  • 1 60Page 6162 85
  •  
  • Post #1,201
  • Quote
  • Apr 10, 2020 5:30pm Apr 10, 2020 5:30pm
  •  L.m
  • | Joined Sep 2015 | Status: Member | 235 Posts
Quoting Igrok
Disliked
theoretically it's still possible to see a diamond on the very top on the DJIA chart... it might look like this... the outcome will be the same though... {image}
Ignored
Hi Igrok,

just a question about what you mentioned in your article. If I got it right, if this was a single diagonal diamond it should be a continuation one. To be a reversal one, given the shape it has now, it must form a double top before reversing.
Or maybe, the "rule" of the single diagonal (about the difference between continuation and reversal diamonds) is not a real rule but just the most likely outcome
Thanks for your reply.
Marco
  • Post #1,202
  • Quote
  • Apr 10, 2020 7:35pm Apr 10, 2020 7:35pm
  •  Igrok
  • Joined Dec 2006 | Status: home alone | 2,499 Posts
Quoting L.m
Disliked
{quote} Hi Igrok, just a question about what you mentioned in your article. If I got it right, if this was a single diagonal diamond it should be a continuation one. To be a reversal one, given the shape it has now, it must form a double top before reversing. Or maybe, the "rule" of the single diagonal (about the difference between continuation and reversal diamonds) is not a real rule but just the most likely outcome Thanks for your reply. Marco
Ignored
exactly.. you're right... in this case to be a reversal it has to form a second top close to the first one...
1
  • Post #1,203
  • Quote
  • Edited at 9:09pm Apr 10, 2020 7:48pm | Edited at 9:09pm
  •  broomstick
  • | Joined May 2019 | Status: Member | 13 Posts
Quoting Igrok
Disliked
{quote} exactly.. you're right... in this case to be a reversal it has to form a second top close to the first one...
Ignored
Igrok,
What are you thoughts on current conditions? I see us having a heavy down week next week, and possibly erasing most, if not all, of recent gains since the initial drop.

You’re saying so far, this isn’t a reversal diamond top. But are you still confident in lower prices moving forward or will that depend on if we make a run for the highs again and complete the diamond top?
1
  • Post #1,204
  • Quote
  • Edited at 7:53pm Apr 11, 2020 3:35am | Edited at 7:53pm
  •  Igrok
  • Joined Dec 2006 | Status: home alone | 2,499 Posts
Quoting broomstick
Disliked
{quote} Igrok, What are you thoughts on current conditions? I see us having a heavy down week next week, and possibly erasing most, if not all, of recent gains since the initial drop. You’re saying so far, this isn’t a reversal diamond top. But are you still confident in lower prices moving forward or will that depend on if we make a run for the highs again and complete the diamond top?
Ignored
I already posted side by side two different markets' charts... one was the oil chart and another was the Dow... what they both so far have in common are the continuation diamonds being formed in the middle of their uptrends... in terms of timing oil was years ahead of the Dow... as of this moment the Dow almost exactly has been mimicking the behavior of the oil prices... as we can see now, the initial correction was exactly the same as it was on oil... same very thing has appeared on both pictures when, after reaching their subsequent MOTs, the prices initially dropped thus reaching the tops of the previous continuation diamonds in the middle... the question now is whether the Dow chart will continue to behave the same way or it will be something different this time... as we can see from the oil chart, the reversal consolidation pattern on the top of the trend was a triangle... I have little doubts that on the longer-term Dow will repeat oil's behavior thus fully covering the previous uptrend... for Dow it means that it will have to reach sub 2008-9 levels no matter what... however the details may vary... it's still possible to see a dual-diagonal reversal diamond, as I outlined it on the previous chart or, perhaps, it might be something else... but I'm afraid that at this point we will have to wait for some sort of a confirmation before coming to a more definitive conclusion...
  • Post #1,205
  • Quote
  • Apr 11, 2020 11:27am Apr 11, 2020 11:27am
  •  L.m
  • | Joined Sep 2015 | Status: Member | 235 Posts
Quoting Igrok
Disliked
{quote} exactly.. you're right... in this case to be a reversal it has to form a second top close to the first one...
Ignored
Perfect, thanks for the answer and all the infos you're sharing.
1
  • Post #1,206
  • Quote
  • Edited at 8:55pm Apr 11, 2020 7:57pm | Edited at 8:55pm
  •  Igrok
  • Joined Dec 2006 | Status: home alone | 2,499 Posts
Quoting L.m
Disliked
{quote} Perfect, thanks for the answer and all the infos you're sharing.
Ignored
welcome... in case of a real dual-diagonal diamond scenario the second diagonal has to be almost symmetrical to the first one... not just in its range but in timing also... this means we're gonna be able to make a good projection for the future quite soon...
1
  • Post #1,207
  • Quote
  • Apr 14, 2020 2:49am Apr 14, 2020 2:49am
  •  eFFx168
  • | Joined May 2019 | Status: Member | 25 Posts
hi sir Igor,

1. Bifurcation theory is so technical I can't connect it with you diamond shape technique, could you sheld a little light about this concept?

2. Do you think cryptocurrency will be used as the different legal tender in your clustering of nation model?

your reply would be appreciated much
  • Post #1,208
  • Quote
  • Apr 14, 2020 4:27am Apr 14, 2020 4:27am
  •  Geresnis
  • | Joined Jan 2013 | Status: Member | 20 Posts
Quoting eFFx168
Disliked
hi sir Igor, 1. Bifurcation theory is so technical I can't connect it with you diamond shape technique, could you sheld a little light about this concept? 2. Do you think cryptocurrency will be used as the different legal tender in your clustering of nation model? your reply would be appreciated much
Ignored
whaats for the Crypto. very possible, see jpm has created one. and these boys are the ones who run sht. https://www.jpmorgan.com/global/news...-coin-payments
  • Post #1,209
  • Quote
  • Apr 14, 2020 4:32am Apr 14, 2020 4:32am
  •  Geresnis
  • | Joined Jan 2013 | Status: Member | 20 Posts
The future of the currencies is realy what worries me. sure all of them depreciate at each other, they are in free fall. but some may be better than others. Here i see 3 of them which may be safe heaven? (JPY,CHF, NOK (Norway has largest fund <1Trilion) would appreciate your insight Igor.
  • Post #1,210
  • Quote
  • Apr 14, 2020 8:14am Apr 14, 2020 8:14am
  •  Igrok
  • Joined Dec 2006 | Status: home alone | 2,499 Posts
Quoting eFFx168
Disliked
hi sir Igor, 1. Bifurcation theory is so technical I can't connect it with you diamond shape technique, could you sheld a little light about this concept? 2. Do you think cryptocurrency will be used as the different legal tender in your clustering of nation model? your reply would be appreciated much
Ignored
1. "bifurcation theory" is a scientific mathematical method of studying dynamic complex systems behaviors... economy in general and markets in particular are the examples of such systems... "visual pattern recognition method" including my "diamond theory" (not necessary just diamonds... all of the repetitive patterns, as a matter of fact...) in my view is the most simplistic way to define the points of change within a particular process and can be applicable to some other studies.... not just the markets...
2. most of people do not understand what money are for and what actually "legal tender" is... by issuing different national currencies the governments of different states thus only guarantee that they agree to accept those notes or bills for all the debt collection purposes (including taxes) from their citizens... people and private businesses do not have the obligation to accept those notes while conducting their activities... therefore "cryptos" are not "legal tenders" and may become ones only when the governments confirm their willingness to accept them as such...
1
  • Post #1,211
  • Quote
  • Apr 14, 2020 8:30am Apr 14, 2020 8:30am
  •  Igrok
  • Joined Dec 2006 | Status: home alone | 2,499 Posts
Quoting Geresnis
Disliked
The future of the currencies is realy what worries me. sure all of them depreciate at each other, they are in free fall. but some may be better than others. Here i see 3 of them which may be safe heaven? (JPY,CHF, NOK (Norway has largest fund <1Trilion) would appreciate your insight Igor.
Ignored
I've never considered currencies as "save haven investments"... by collecting money such an investor has nothing more in return than the promise of the subsequent governments that under any circumstance the state will accept its currency as a legal tender for debt collection purposes...
  • Post #1,212
  • Quote
  • Apr 14, 2020 2:28pm Apr 14, 2020 2:28pm
  •  mga35
  • | Joined Mar 2019 | Status: Follow the Big Money | 178 Posts
S&P500 performing as if everything is fine and there is no pandemic!!!
Any-thoughts where is it heading?
  • Post #1,213
  • Quote
  • Edited at 9:44pm Apr 14, 2020 7:15pm | Edited at 9:44pm
  •  Igrok
  • Joined Dec 2006 | Status: home alone | 2,499 Posts
Quoting mga35
Disliked
S&P500 performing as if everything is fine and there is no pandemic!!! Any-thoughts where is it heading?
Ignored
it will go down the drain as everything else...unlike the Dow effectively getting to 18300 initially, S&P hasn't even hit yet its absolutely "must reach" level at 2121... though the longer-term target is located at slightly above 400 mark...
2
  • Post #1,214
  • Quote
  • Apr 15, 2020 8:54am Apr 15, 2020 8:54am
  •  Igrok
  • Joined Dec 2006 | Status: home alone | 2,499 Posts
it seems DXY is set to retest 103 soon... 102.50 is a must...
1
  • Post #1,215
  • Quote
  • Apr 15, 2020 2:19pm Apr 15, 2020 2:19pm
  •  Argo
  • | Joined Mar 2008 | Status: Member | 139 Posts
Good day Igor,

Looking at the big picture of DXY, for a few years pattern of diamond like shape is being formed in the middle of the up trend. Based on the theory "every trend will be covered and average cycle takes 8 years" Perhaps we can assume what brake out of the pattern will be to the upside and will reach highs of 2002 at 120 mark really soon. Also completion of the pattern based on the symmetry may take another year before price clears out of the the range i.e. after forming a right side.
On a smaller scale DXY has change MMY for a three times this year making another change of MM unlikely and trading ranges have doubled in average which is expected behavior after long narrow consolidation. Currently MMY is to the up and am assuming your call is based on open gaps MMY and perhaps other clues you may want to point out.

Thank you.
Attached Image (click to enlarge)
Click to Enlarge

Name: USINDEX.PNG
Size: 91 KB
1
  • Post #1,216
  • Quote
  • Edited at 8:12pm Apr 15, 2020 7:39pm | Edited at 8:12pm
  •  Igrok
  • Joined Dec 2006 | Status: home alone | 2,499 Posts
Quoting Argo
Disliked
Good day Igor, Looking at the big picture of DXY, for a few years pattern of diamond like shape is being formed in the middle of the up trend. Based on the theory "every trend will be covered and average cycle takes 8 years" Perhaps we can assume what brake out of the pattern will be to the upside and will reach highs of 2002 at 120 mark really soon. Also completion of the pattern based on the symmetry may take another year before price clears out of the the range i.e. after forming a right side. On a smaller scale DXY has change MMY for a three...
Ignored
I agree with almost everything you just wrote here... however it's a long shot to project that previous downtrend being fully covered at this very point... for the moment it looks more like some sort of consolidation on DXY is possible within 92.00 - 104.00 range... but longer-term I would rather anticipate a down-trend to resume and 79.00 being the initial target... there are some "unpaid debts" down there...
1
  • Post #1,217
  • Quote
  • Apr 16, 2020 6:11am Apr 16, 2020 6:11am
  •  Argo
  • | Joined Mar 2008 | Status: Member | 139 Posts
So going back to the current situation the facts are Price have expanded the range first brake out was to the downside which is a fake and second brake out to the upside after that may be a true direction. After making a Year high at 103.90 and changing a MM to up price retraced to the pendulum and in many cases this may be a support/resistance making next move to the upside more likely to close a gap and test the year high but not surpassing it - the year range is exhausted and price may stay in the current range till the end of the year.

As far as targets below the couple of flat levels are apparent 94.60 next one is low from 19 Sep 2018 is to flat to be a significant but rather a magnet as well as MACD divergence on weekly and after that is the top of a diamond.

Perhaps you can point out some other UNPAID DEBTS and reasons for move sequences.

This is all for educational purposes only and cant be treated as trade signals.

Thanks you.
Attached Image (click to enlarge)
Click to Enlarge

Name: USDINDEX1.PNG
Size: 89 KB
  • Post #1,218
  • Quote
  • Apr 16, 2020 6:52am Apr 16, 2020 6:52am
  •  Igrok
  • Joined Dec 2006 | Status: home alone | 2,499 Posts
Quoting Argo
Disliked
Perhaps you can point out some other UNPAID DEBTS and reasons for move sequences.
Ignored
there is a gap up there at 1.3340 on the EUR/USD... and another one (that nobody can see now but I remember it) at 1.3380... same area it is where a small intraday continuation diamond had been formed back in 2014... that corresponds with DXY at 79.00... also a long-term trendline on EUR/USD with three touches is a magnet and the fourth one will be a breakout... thus 1.3380 on the EUR/USD is a must...
1
  • Post #1,219
  • Quote
  • Apr 16, 2020 9:06am Apr 16, 2020 9:06am
  •  Argo
  • | Joined Mar 2008 | Status: Member | 139 Posts
Thanks for that Igor
I can see plenty of targets to the upside in EUR I just wanted to find our why is 102.50 on DAX is the must? In this case sequence of moves for EUR will be down to test lows of the year once again or perhaps 1.04 and and continue oscillate in the range 1.04-1.014 for the rest of the year before braking higher?

Thanks again for your explanations
1
  • Post #1,220
  • Quote
  • Apr 17, 2020 11:46am Apr 17, 2020 11:46am
  •  Igrok
  • Joined Dec 2006 | Status: home alone | 2,499 Posts
Quoting Argo
Disliked
Thanks for that Igor I can see plenty of targets to the upside in EUR I just wanted to find our why is 102.50 on DAX is the must? In this case sequence of moves for EUR will be down to test lows of the year once again or perhaps 1.04 and and continue oscillate in the range 1.04-1.014 for the rest of the year before braking higher? Thanks again for your explanations
Ignored
DAX????... at 102.50????.... I don't remember posting that... where did you get it from?...


BTW there was the same old diamond on the DAX 30 as well... also it has already hit its "must reach" level that would be the Fibo at 38.2% retracement as shown on this chart...
Attached Image (click to enlarge)
Click to Enlarge

Name: Screenshot1.png
Size: 116 KB
1
  • Trading Discussion
  • /
  • The end of the US stock market is nearing
  • Reply to Thread
    • 1 5960Page 616263 85
    • 1 60Page 6162 85
0 traders viewing now
  • More
Top of Page
  • Facebook
  • Twitter
About FF
  • Mission
  • Products
  • User Guide
  • Media Kit
  • Blog
  • Contact
FF Products
  • Forums
  • Trades
  • Calendar
  • News
  • Market
  • Brokers
  • Trade Explorer
FF Website
  • Homepage
  • Search
  • Members
  • Report a Bug
Follow FF
  • Facebook
  • Twitter

FF Sister Sites:

  • Metals Mine
  • Energy EXCH
  • Crypto Craft

Forex Factory® is a brand of Fair Economy, Inc.

Terms of Service / ©2021