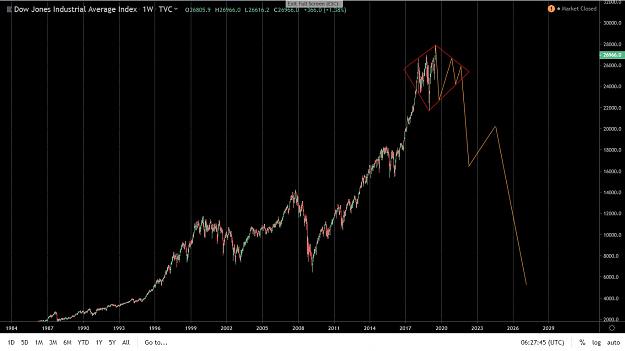
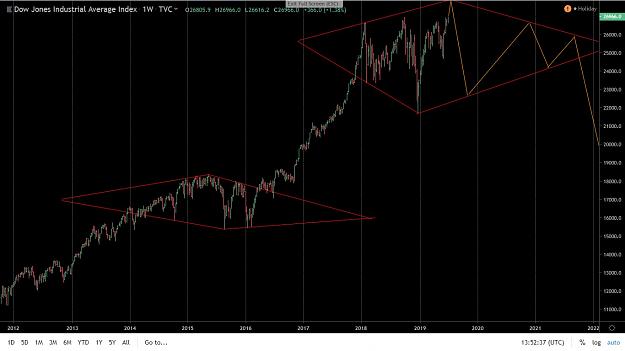
DJIA and S&P have reached their new historical highs yesterday... for the Dow it means that the bullish wave that started forming on December 26, 2018 and which bottomed out at 21712,5 is gonna be the last one on its predominantly bullish historical chart... so. the market is likely to reach its absolute top before the end of this year... most likely even before the end of September, 2019... from that point it is quite likely to turn around and to target the lows of 2009 once again thus reaching 5000-5500 level within the next 3-5 years... seems like another Great Depression 2.0 is on the cards.... this projection chart below seems as the most likely case scenario for the Dow in the not so distant future... before that a reversal single-diagonal diamond is also quite likely to be formed...
Attached Image (click to enlarge)