Project 11 started
Big player algorithms
Hello dear subscribers,
we still remember earlier stock market times, when traders shouted at each other to announce their prices and a thousand pieces of paper were lying on the floor. The stock exchanges have gradually changed from an analogue world to a digital world. Everything happens today in large central computers. The amount of data that is produced is so huge that tracking certain activities can be compared to a spacecraft search in space. With the arrival of memory-intensive data centers, ever more complex programs could be developed, which brought an advantage in retail. The high-frequency traders began to use the speed of trading for their purposes in 2004. But you can't act faster than the light and so there are natural limits to the speed at some point. Theoretically, it is only possible to reach these limits with microwaves, but this technique requires a great deal of money. The proximity to the stock exchange is also a crucial point. The next decisive factor is the computing power of the high-performance computers used. Big players like to grab use processors that are not yet available on the market and that will be extremely overclocked and cooled. But the next generation is quantum computers, which are 1000 times faster than conventional data centers. IBM developed the first quantum computer that costs 650 million euros. For some big players, this shouldn't be an obstacle, considering that Goldman Sachs has returned to $ 50-60 million daily profits since they made themselves available liquidity in EURUSD.
In the video that I have provided you with some things are described how the manipulation on the stock exchange works.
The money robot
Not only the high-frequency traders manipulate, but also the big players and the stock exchanges. Everyone wants the biggest piece of the cake. The manipulations described in the video are only the tip of the iceberg, we can assume that there are significantly more cases that cannot be uncovered at the moment because there is no technology for this. Exchange supervision is also overwhelmed because there are too few specialists on the “good side”. It is clear that a good lawyer will always earn more than a public prosecutor. A a quant from a high frequency trader, will earn 10 times more than if he work for the stock exchange regulator. Money is not always the decisive factor, but unfortunately too often. At the latest now, a retail trader would have to realize that with a MACD, RSI or moving average, you only have one firework rocket in your hand while the big players are working with a space shuttle rocket. The outcome of this is shown by the loss figures of retail traders, which every broker must state on their website. (But these figures are also positively optimized by the broker).
The stock market is a billion dollar business, in the Forex market alone the big players win $ 400 million a day, in the calculation there are no stock exchanges included. There are simply too many conflicts of interest in this market that prevent this market from being fair and honest. A trader who is trading here should be aware of this. It is interesting to know that big players are given preferential treatment in limit orders and market orders. When a retail trader places a limit order, he has to queue, the one who queues first is served first. This is the nice theory that looks completely different in practice. If you trade a lot, you automatically ensure that the exchanges earn more spread, three times you can guess who is given preferential treatment. The big players founded dark pools to exclude the high-frequency traders from trading, but a few years later the high-frequency traders also were be able to trade in these dark pools because they achieved huge sales that generated high spreads for the operator. According to the motto: Everyone thinks of themselves, only I think of myself.
I do not want to scare the reader here or show that it is impossible to win in the stock market. But whoever gets involved in the stock exchange world should know exactly who he is actually trading against. As a retail trader, we first trade against our broker, our broker acts against the bank and the stock exchange is on the side that generates the most turnover. The stock exchange supervisory authority watches and work together with the exchange. Because if the stock exchange supervisory authority destroyed the stock exchange, the stock exchange supervisory authority would no longer have a right to exist. Of course, every now and then a little culprit is arrested and released to the press, but the crucial culprits ensure the necessary turnover every day so that everyone can make a good living from it. You should never hit the hand that feeds you. This world is a shark tank, there are sharks (BigPlayer) that eat the small fish (Retail Trader). And there are the cleaner fish (3-5% of retail traders) that clean the teeth of the sharks after their meal. These cleaner fish are not eaten, but cleaning teeth also gives the cleaner fish their meal (profits).
We have now highlighted two important points, the speed of trading and the hardware with which the big players gain an advantage in the market. Now we come to the third and decisive point: the algorithms.
Algorithmic trading is an automated strategy that refers to the identification or execution of trades. It is not just about entering orders in trading, but the entire research and order process is considerably simplified by the algorithms.
On the slide, I first listed different variants for identifying algorithms. Of course, no trader would work with such a view, it is only meant to illustrate that there are many ways to get there. We'll be looking at different views over the next few weeks to find the most effective way to identify the algorithms.
In principle, algorithmic trading is a black box that contains different instructions as to when a trade is to be made or should be dissolved. A simple example of this are two moving moving averages in EURUSD. If the shorter moving average crosses the longer moving average from top to bottom, the dollar is bought and if the shorter moving average crosses the longer moving average from bottom to top the euro is bought. Most trading systems are far more complex, however, they follow a systematic, rules-based approach that is stored in a black box. The algorithm then monitors the market to see when all the necessary conditions have been met. The orders are then generated automatically and transmitted to the exchange. As soon as a trade is executed, the black box receives a message to update the position and order management tools.
Many traders also use algorithmic trading. Platforms such as MetaTrader enable traders with very little programming knowledge to easily set up automated systems. These are very popular in the foreign exchange market because they can run around the clock.
An EA can identify opportunities that match the terms of a particular strategy and execute trades much faster than a human trader without thinking. Opportunities that only exist for a fraction of a second are seized, and no trade is missed that meets the specified criteria. Algorithmic trading is less prone to human error. On the one hand, this applies to research, the identification of opportunities and the execution of trades. Although these EA's offer some advantages, one should also consider the disadvantages and risks.
Algorithmic trading systems cannot adapt to changing market conditions like human traders can. It is very difficult to find out in the short term whether these trading systems are still working profitably or have already passed their zenith. Large volatility phases and crashes are a great challenge for EA's, as this creates the risk of higher spreads or over night gaps. Systematic trading strategies do not develop indefinitely, since the competition also creates corresponding trading systems that work with similar patterns. The more you work according to a similar strategy, the sooner the advantage of a system is undermined. The lower the margins achieved within a trading system, the higher the chance that transaction costs can quickly eat up profits.
So far, there is no EA worldwide that has achieved consistent and secure profits over a longer period of time, within different market phases. If that worked, the big players would have chased all analysts and traders to hell and would only work with such EA's. What has kept me from working with EA's so far is the fact that EA's, needs indicators link together as a condition, to generate entries or exits. In my view, because indicators run after price, they are unsuitable for creating trading strategies. In addition, you should be aware that an EA only runs in the market of the respective broker and not actually on the stock exchange.
It looks very different in the real stock market, provided you refer to limit orders and market orders. These are not indicators, but rather crucial orders that actually move or stop the price. Algorithmic trading systems have a completely different meaning here.
If you create an algorithm and combine 10 different indicators as conditions, there could be problems in performance and the data information could be watered down. In the equity area, algorithmic trading systems can bring enormous advantages because they can directly take into account information from company balance sheets, data from news and social media platforms, company values, current growth, dividend yield and momentum. A human being is not able to do this at the same time.
There are different strategies in the area of rule-based algorithms: trend-following strategies, mean reversion strategies, arbitrage trading strategies, VWAP and TWAP algorithms, quantitative investment strategies, quantitative trading strategies and index strategies to name just a few. We are primarily interested only in the strategies of the big players, since they move 85% of the market in their direction. In contrast to the big players, the institutional traders work more with algorithmic trading systems, which, however, are less relevant for me, since they do not have great market power with a 10% market share.
First of all, it is interesting to know that 33% of fund managers, 25% of hedge funds and 11% of big players use algorithms. The big players are among the most successful traders in the world and only use algorithms to 11%, which should initially make us think. The answer is very simple: a fully automated trading system is inferior to the experience of the big players. But they use algorithms, much like we do when driving. We use ABS and EPS but we still drive ourselves and don't let the computer drive.
Let's take a closer look at the big player algorithms. There are three different types of algorithms that big players work with: information algorithms, analysis algorithms and trading algorithms. The information algorithms help the big players to read and analyze news feeds in order to obtain correspondingly faster information. The analysis algorithms run on special computers that scan the market and look for hidden orders and stops. Among other things, they work with the tricks already described that we know from high-frequency retailers: wash trades, quote stuffing, spoofing and sniping. The losses that arise are in principle only a small collateral damage. The information from these special computers runs into a main computer, which internally gives information about possible larger stop accumulations. After that, the big players decide whether it is worth taking these stops or not.
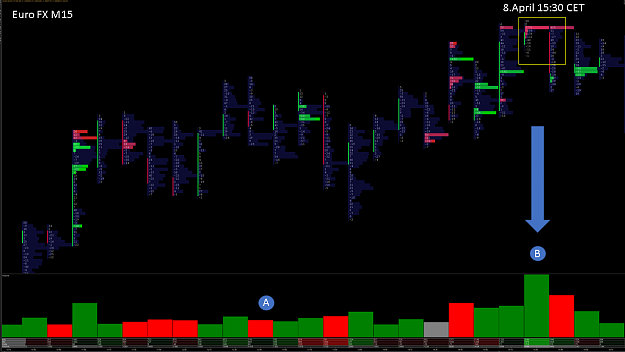
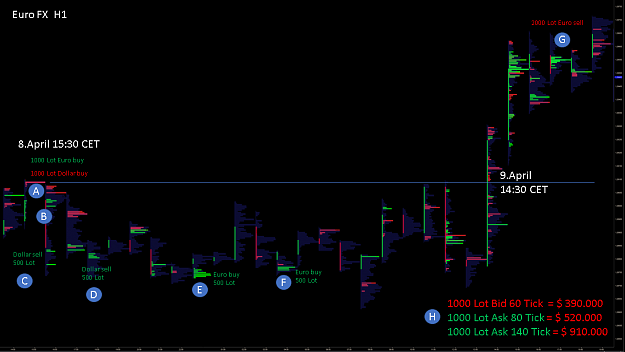
For trading, the big players use simple programs of the first and second generation that only break down large buy / sell orders into pieces in order to limit the effects of large orders on the market. The algorithms are primarily used to create the iceberg orders, since the big players are mainly in the limit orders area. An iceberg order is used in the limit area to absorb the volume of the triggered stops. The iceberg orders are limit orders, where further limit orders are gradually added. If a big player placed a large limit order in the market, many traders could see this and would assume that the price trend would change at this point. To disguise this, the fragmented iceberg order is used. For a few months now, further algorithms have been programmed that enable the big players to provide themselves with liquidity. In the process, a few 1000 Lot Buy Market Orders are placed in the market within seconds, which are simultaneously taken up by Sell Limit Orders.
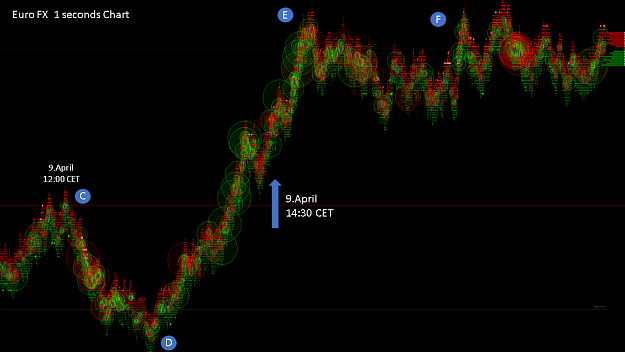
The market is only registering a sharp increase in buy market orders at this moment and the majority of traders are positioning themselves long. However, the market is slowly moving upwards as the big player begins to sell his euro positions to the willing long traders. As soon as the big player is out of his euro position, there is only one 2000 Lot Sell Market Order left in the market. First he lets the market run up a little to take out the short traders, then he pushes the market down with cumulative sell market orders until he triggers the first stops of the long traders. Then a chain reaction begins, the stops of the long traders move the price lower and trigger further stops. Now many new market participants are starting to position themselves short. This is a good opportunity for the big player to push the market again up to get more liquidity. And then the same game repeats itself over and over again.
Conclusion:
Algorithmic trading has changed the financial markets, but the big players only work with algorithms in the most efficient areas to disguise their plans. Whoever concentrates on the volume has no chance of identifying this procedure. The big players use the algorithms sparingly and are therefore easier for us to identify. The most successful traders in the world still mostly trades manual, whereby they have trades controlled by algorithms. However, it clearly shows that fully automated trading systems are significantly inferior to the experience of analysts and traders of the big players. The big players use the latest technology in the form of ABS and EPS, but they still control the vehicle themselves and that will not change in the next few years. Good for us, because using larger algorithms would make our identification considerably more difficult. First of all, I recommend all traders to deal with stophunting again.
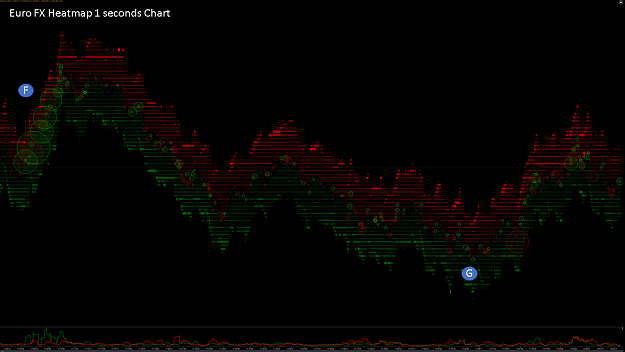
We have to think of the big players' workplace as a large swimming pool that is 1 mile long. A tall player cannot fully dive this mile because he runs out of air in between. On the bottom of the large swimming pool there are small and large oxygen bottles on the right and left, which the big player tries to reach to take a breath and to continue swimming afterwards. So he dives the 1 mile in the Zig Zag by always swimming to the areas where he may get the most oxygen. And this oxygen is comparable to the volume provided by the stops. He takes up this volume with his limit orders or uses the triggering of the stops to run the price in his direction. So we should always ask ourselves where the largest volume, in the form of stops, is currently on the market. These are exactly the zones that the big player is heading for next. And that's exactly what we can identify with Stophunting.
The algorithms help us to recognize whether a big player is currently moving the market with market orders or is holding up the market with his limit orders. We will talk about this in more detail in the next few weeks and look at concrete explanations in practice.
I wish you a successful trading week.
best regards
Michael
Big player algorithms
Hello dear subscribers,
we still remember earlier stock market times, when traders shouted at each other to announce their prices and a thousand pieces of paper were lying on the floor. The stock exchanges have gradually changed from an analogue world to a digital world. Everything happens today in large central computers. The amount of data that is produced is so huge that tracking certain activities can be compared to a spacecraft search in space. With the arrival of memory-intensive data centers, ever more complex programs could be developed, which brought an advantage in retail. The high-frequency traders began to use the speed of trading for their purposes in 2004. But you can't act faster than the light and so there are natural limits to the speed at some point. Theoretically, it is only possible to reach these limits with microwaves, but this technique requires a great deal of money. The proximity to the stock exchange is also a crucial point. The next decisive factor is the computing power of the high-performance computers used. Big players like to grab use processors that are not yet available on the market and that will be extremely overclocked and cooled. But the next generation is quantum computers, which are 1000 times faster than conventional data centers. IBM developed the first quantum computer that costs 650 million euros. For some big players, this shouldn't be an obstacle, considering that Goldman Sachs has returned to $ 50-60 million daily profits since they made themselves available liquidity in EURUSD.
In the video that I have provided you with some things are described how the manipulation on the stock exchange works.
The money robot
Not only the high-frequency traders manipulate, but also the big players and the stock exchanges. Everyone wants the biggest piece of the cake. The manipulations described in the video are only the tip of the iceberg, we can assume that there are significantly more cases that cannot be uncovered at the moment because there is no technology for this. Exchange supervision is also overwhelmed because there are too few specialists on the “good side”. It is clear that a good lawyer will always earn more than a public prosecutor. A a quant from a high frequency trader, will earn 10 times more than if he work for the stock exchange regulator. Money is not always the decisive factor, but unfortunately too often. At the latest now, a retail trader would have to realize that with a MACD, RSI or moving average, you only have one firework rocket in your hand while the big players are working with a space shuttle rocket. The outcome of this is shown by the loss figures of retail traders, which every broker must state on their website. (But these figures are also positively optimized by the broker).
The stock market is a billion dollar business, in the Forex market alone the big players win $ 400 million a day, in the calculation there are no stock exchanges included. There are simply too many conflicts of interest in this market that prevent this market from being fair and honest. A trader who is trading here should be aware of this. It is interesting to know that big players are given preferential treatment in limit orders and market orders. When a retail trader places a limit order, he has to queue, the one who queues first is served first. This is the nice theory that looks completely different in practice. If you trade a lot, you automatically ensure that the exchanges earn more spread, three times you can guess who is given preferential treatment. The big players founded dark pools to exclude the high-frequency traders from trading, but a few years later the high-frequency traders also were be able to trade in these dark pools because they achieved huge sales that generated high spreads for the operator. According to the motto: Everyone thinks of themselves, only I think of myself.
I do not want to scare the reader here or show that it is impossible to win in the stock market. But whoever gets involved in the stock exchange world should know exactly who he is actually trading against. As a retail trader, we first trade against our broker, our broker acts against the bank and the stock exchange is on the side that generates the most turnover. The stock exchange supervisory authority watches and work together with the exchange. Because if the stock exchange supervisory authority destroyed the stock exchange, the stock exchange supervisory authority would no longer have a right to exist. Of course, every now and then a little culprit is arrested and released to the press, but the crucial culprits ensure the necessary turnover every day so that everyone can make a good living from it. You should never hit the hand that feeds you. This world is a shark tank, there are sharks (BigPlayer) that eat the small fish (Retail Trader). And there are the cleaner fish (3-5% of retail traders) that clean the teeth of the sharks after their meal. These cleaner fish are not eaten, but cleaning teeth also gives the cleaner fish their meal (profits).
We have now highlighted two important points, the speed of trading and the hardware with which the big players gain an advantage in the market. Now we come to the third and decisive point: the algorithms.
Attached Image (click to enlarge)
Algorithmic trading is an automated strategy that refers to the identification or execution of trades. It is not just about entering orders in trading, but the entire research and order process is considerably simplified by the algorithms.
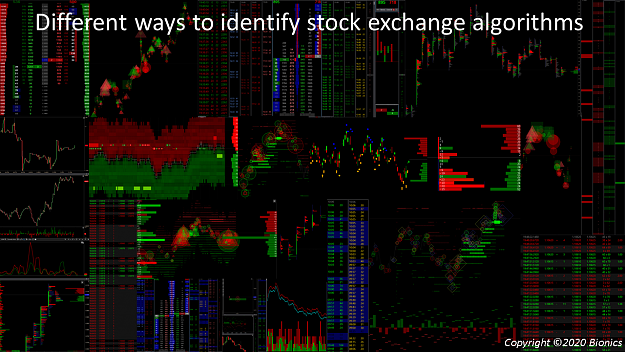
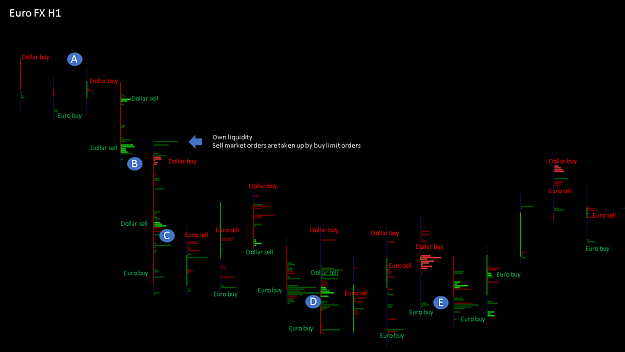
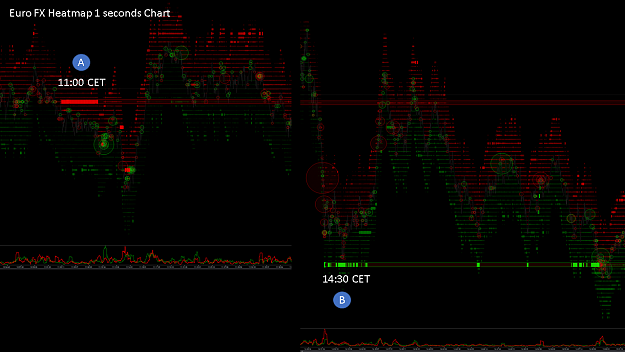
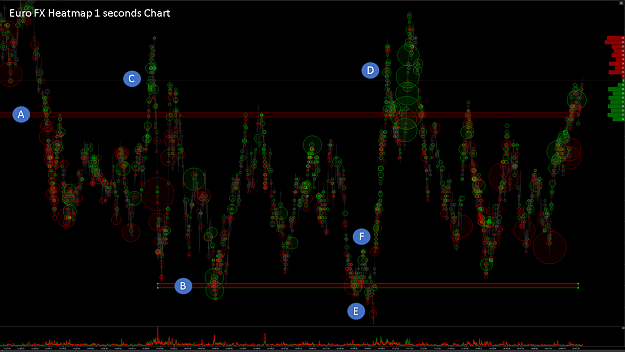
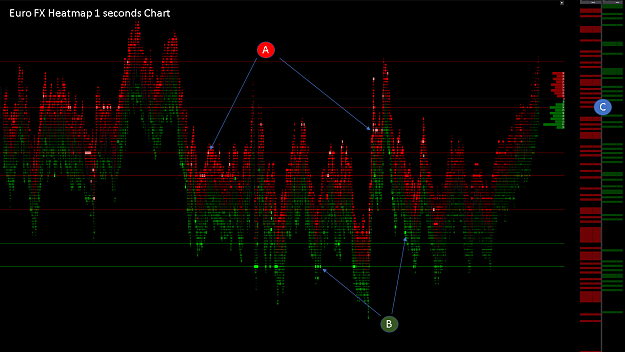
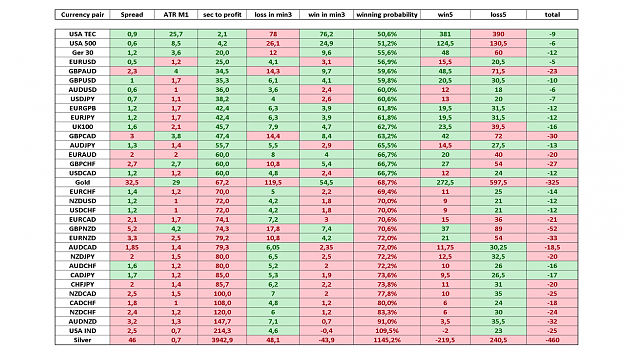
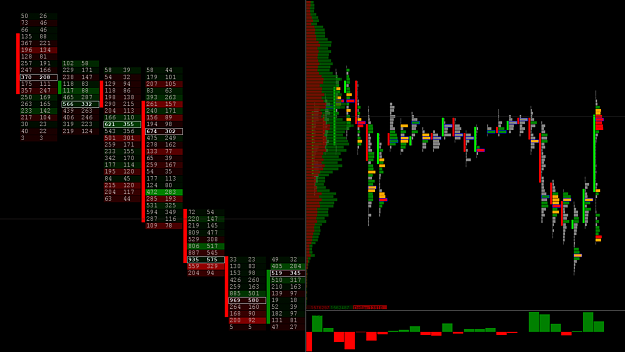
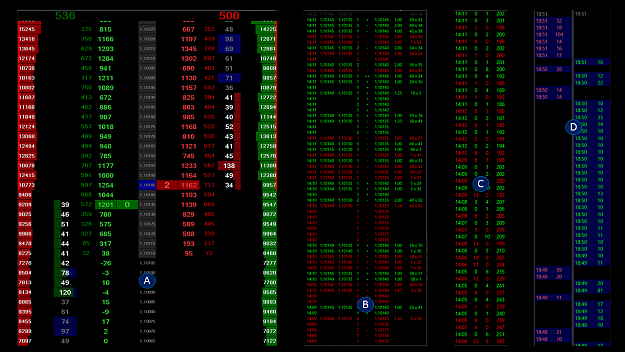
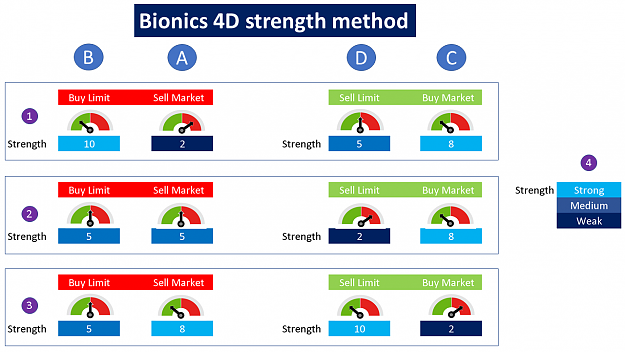
On the slide, I first listed different variants for identifying algorithms. Of course, no trader would work with such a view, it is only meant to illustrate that there are many ways to get there. We'll be looking at different views over the next few weeks to find the most effective way to identify the algorithms.
In principle, algorithmic trading is a black box that contains different instructions as to when a trade is to be made or should be dissolved. A simple example of this are two moving moving averages in EURUSD. If the shorter moving average crosses the longer moving average from top to bottom, the dollar is bought and if the shorter moving average crosses the longer moving average from bottom to top the euro is bought. Most trading systems are far more complex, however, they follow a systematic, rules-based approach that is stored in a black box. The algorithm then monitors the market to see when all the necessary conditions have been met. The orders are then generated automatically and transmitted to the exchange. As soon as a trade is executed, the black box receives a message to update the position and order management tools.
Many traders also use algorithmic trading. Platforms such as MetaTrader enable traders with very little programming knowledge to easily set up automated systems. These are very popular in the foreign exchange market because they can run around the clock.
An EA can identify opportunities that match the terms of a particular strategy and execute trades much faster than a human trader without thinking. Opportunities that only exist for a fraction of a second are seized, and no trade is missed that meets the specified criteria. Algorithmic trading is less prone to human error. On the one hand, this applies to research, the identification of opportunities and the execution of trades. Although these EA's offer some advantages, one should also consider the disadvantages and risks.
Algorithmic trading systems cannot adapt to changing market conditions like human traders can. It is very difficult to find out in the short term whether these trading systems are still working profitably or have already passed their zenith. Large volatility phases and crashes are a great challenge for EA's, as this creates the risk of higher spreads or over night gaps. Systematic trading strategies do not develop indefinitely, since the competition also creates corresponding trading systems that work with similar patterns. The more you work according to a similar strategy, the sooner the advantage of a system is undermined. The lower the margins achieved within a trading system, the higher the chance that transaction costs can quickly eat up profits.
So far, there is no EA worldwide that has achieved consistent and secure profits over a longer period of time, within different market phases. If that worked, the big players would have chased all analysts and traders to hell and would only work with such EA's. What has kept me from working with EA's so far is the fact that EA's, needs indicators link together as a condition, to generate entries or exits. In my view, because indicators run after price, they are unsuitable for creating trading strategies. In addition, you should be aware that an EA only runs in the market of the respective broker and not actually on the stock exchange.
It looks very different in the real stock market, provided you refer to limit orders and market orders. These are not indicators, but rather crucial orders that actually move or stop the price. Algorithmic trading systems have a completely different meaning here.
If you create an algorithm and combine 10 different indicators as conditions, there could be problems in performance and the data information could be watered down. In the equity area, algorithmic trading systems can bring enormous advantages because they can directly take into account information from company balance sheets, data from news and social media platforms, company values, current growth, dividend yield and momentum. A human being is not able to do this at the same time.
There are different strategies in the area of rule-based algorithms: trend-following strategies, mean reversion strategies, arbitrage trading strategies, VWAP and TWAP algorithms, quantitative investment strategies, quantitative trading strategies and index strategies to name just a few. We are primarily interested only in the strategies of the big players, since they move 85% of the market in their direction. In contrast to the big players, the institutional traders work more with algorithmic trading systems, which, however, are less relevant for me, since they do not have great market power with a 10% market share.
First of all, it is interesting to know that 33% of fund managers, 25% of hedge funds and 11% of big players use algorithms. The big players are among the most successful traders in the world and only use algorithms to 11%, which should initially make us think. The answer is very simple: a fully automated trading system is inferior to the experience of the big players. But they use algorithms, much like we do when driving. We use ABS and EPS but we still drive ourselves and don't let the computer drive.
Let's take a closer look at the big player algorithms. There are three different types of algorithms that big players work with: information algorithms, analysis algorithms and trading algorithms. The information algorithms help the big players to read and analyze news feeds in order to obtain correspondingly faster information. The analysis algorithms run on special computers that scan the market and look for hidden orders and stops. Among other things, they work with the tricks already described that we know from high-frequency retailers: wash trades, quote stuffing, spoofing and sniping. The losses that arise are in principle only a small collateral damage. The information from these special computers runs into a main computer, which internally gives information about possible larger stop accumulations. After that, the big players decide whether it is worth taking these stops or not.
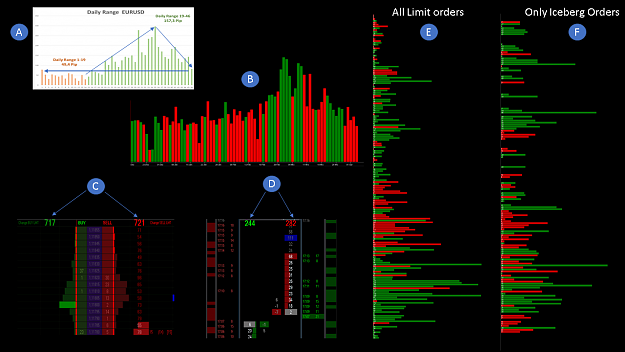
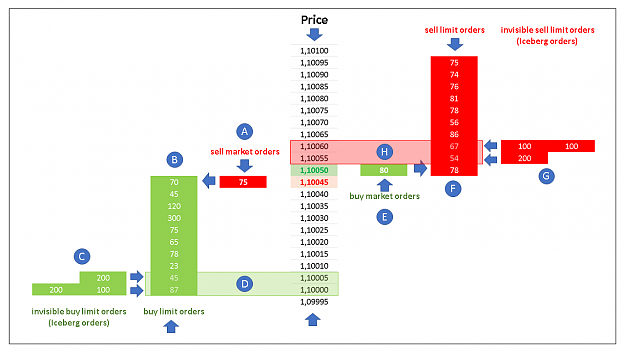
For trading, the big players use simple programs of the first and second generation that only break down large buy / sell orders into pieces in order to limit the effects of large orders on the market. The algorithms are primarily used to create the iceberg orders, since the big players are mainly in the limit orders area. An iceberg order is used in the limit area to absorb the volume of the triggered stops. The iceberg orders are limit orders, where further limit orders are gradually added. If a big player placed a large limit order in the market, many traders could see this and would assume that the price trend would change at this point. To disguise this, the fragmented iceberg order is used. For a few months now, further algorithms have been programmed that enable the big players to provide themselves with liquidity. In the process, a few 1000 Lot Buy Market Orders are placed in the market within seconds, which are simultaneously taken up by Sell Limit Orders.
The market is only registering a sharp increase in buy market orders at this moment and the majority of traders are positioning themselves long. However, the market is slowly moving upwards as the big player begins to sell his euro positions to the willing long traders. As soon as the big player is out of his euro position, there is only one 2000 Lot Sell Market Order left in the market. First he lets the market run up a little to take out the short traders, then he pushes the market down with cumulative sell market orders until he triggers the first stops of the long traders. Then a chain reaction begins, the stops of the long traders move the price lower and trigger further stops. Now many new market participants are starting to position themselves short. This is a good opportunity for the big player to push the market again up to get more liquidity. And then the same game repeats itself over and over again.
Conclusion:
Algorithmic trading has changed the financial markets, but the big players only work with algorithms in the most efficient areas to disguise their plans. Whoever concentrates on the volume has no chance of identifying this procedure. The big players use the algorithms sparingly and are therefore easier for us to identify. The most successful traders in the world still mostly trades manual, whereby they have trades controlled by algorithms. However, it clearly shows that fully automated trading systems are significantly inferior to the experience of analysts and traders of the big players. The big players use the latest technology in the form of ABS and EPS, but they still control the vehicle themselves and that will not change in the next few years. Good for us, because using larger algorithms would make our identification considerably more difficult. First of all, I recommend all traders to deal with stophunting again.
Attached Image (click to enlarge)
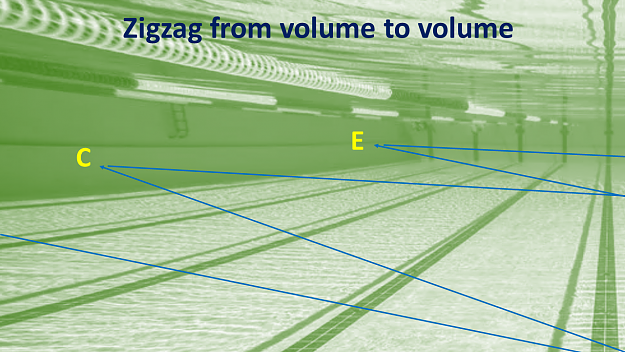
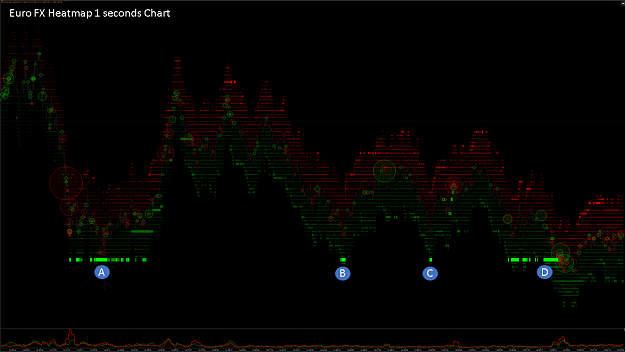
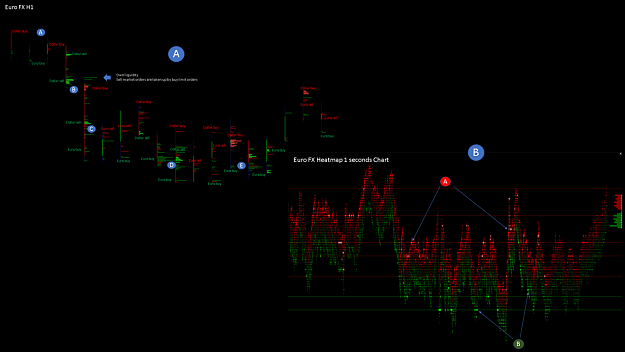
We have to think of the big players' workplace as a large swimming pool that is 1 mile long. A tall player cannot fully dive this mile because he runs out of air in between. On the bottom of the large swimming pool there are small and large oxygen bottles on the right and left, which the big player tries to reach to take a breath and to continue swimming afterwards. So he dives the 1 mile in the Zig Zag by always swimming to the areas where he may get the most oxygen. And this oxygen is comparable to the volume provided by the stops. He takes up this volume with his limit orders or uses the triggering of the stops to run the price in his direction. So we should always ask ourselves where the largest volume, in the form of stops, is currently on the market. These are exactly the zones that the big player is heading for next. And that's exactly what we can identify with Stophunting.
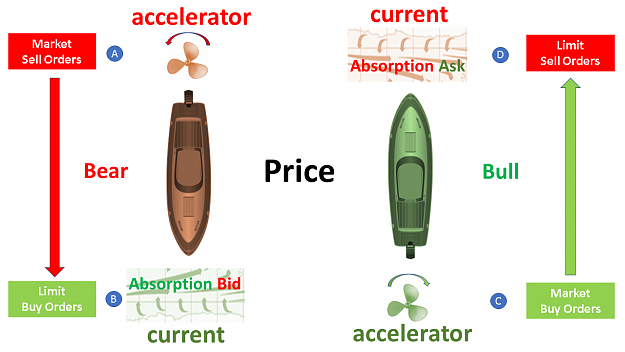
The algorithms help us to recognize whether a big player is currently moving the market with market orders or is holding up the market with his limit orders. We will talk about this in more detail in the next few weeks and look at concrete explanations in practice.
I wish you a successful trading week.
best regards
Michael
Forget:That does not work, amateurs build the ark, pros the Titanic!
5
![Click to Enlarge
Name: GBEbrokers-LIVE - [EURUSDc,M1] 2020-04-06 14.54.29.png
Size: 35 KB](/attachment/image/3598956/thumbnail?d=1586177931)
![Click to Enlarge
Name: FB_IMG_1586604636112[1].jpg
Size: 50 KB](/attachment/image/3603552/thumbnail?d=1586627616)
![Click to Enlarge
Name: GBEbrokers-LIVE - [EURUSDc,M1] 2020-04-14 17.09.53.png
Size: 41 KB](/attachment/image/3605693/thumbnail?d=1586877274)
![Click to Enlarge
Name: 6EM0 M1 chart [Continuous] 2020-04-14 16.53.52.png
Size: 41 KB](/attachment/image/3605694/thumbnail?d=1586877282)
![Click to Enlarge
Name: 6EM0 30 Seconds chart [Continuous] 2020-04-17 10.49.54.png
Size: 40 KB](/attachment/image/3608818/thumbnail?d=1587113628)
![Click to Enlarge
Name: GBEbrokers-LIVE - [EURUSDc,M1] 2020-04-17 11.03.38.png
Size: 50 KB](/attachment/image/3608831/thumbnail?d=1587114338)