Project No. 10
A completely new market view
Hello dear subscribers,
As promised, we are starting today with our new project No. 10. In this project we will see that the limit orders are more crucial for the long-term price trend than the market orders. And I will show you how to make limit orders visible. In the next few weeks we will deal with the future data in more detail. Our project no. 9 (Stophunting) will continue to accompany us. If you want to be successful in this market in the long term, you need to take a closer look, how big players work. A price does not change because a moving average has crossed, an RSI is overbought or a fibozone has been reached, but because there are more short traders than long traders in a downward movement and more long traders than short traders in an upward movement. The big players determine the market and they pursue a goal. This goal can only be recognized if you know what they are up to. Their plan can be identified by the limit orders. We want to start with that today.
In the past 10 years I was lucky enough to take the smaller movements up to 10 pip within one equilibrium and was therefore able to act profitably. However, I was unlucky enough to never know exactly what was happening in the market. FF motivated me to write down my thoughts on trading over 2 years ago. At first I tried to describe my approach exactly and quickly realized that this is not so easy. The more I wrote, the more questions I had. Every question I answered myself took me a step further, but more and more questions came up and prompted me to dig deeper into the subject. With the tick charts, a kind of breakthrough came into the world of stock market data. At first I wanted to know exactly how these tick charts are calculated in Forex and at the same time I recognized the incompleteness and limitation of this calculation. Many years ago I heard about the volume that was presented with footprint charts, volume profile and market profile. But all these chart representations make no sense in Forex, since no data feeds are provided for them. Why deal with something that is not feasible.
First of all, I wanted to know how a tick chart in Forex differs from a tick chart in Future. So I got futures data, but these pure futures data alone couldn't give me a clear answer. The MT5 was the worst alternative to optimally display futures data, as well as other trading platforms such as Ninja Trader, Multicharts, Sierra Chart or Jigsaw could not satisfy my requirements. I chose a professional proprietary trading platform. This enabled me to filter and display the pure stock market data in such a way that it made sense to me. I started to compare the tickchart in the forex with the tickchart in the future. It struck me that the course behaved almost exactly the same, but the prices were different due to the swaps. I am one of the 4% of professional Forex traders in Europe who can trade up to 400 with a lever and at the same time I have extremely good protection in the event of an uncontrolled breakout. Since the EURUSD has the highest liquidity in the Forex market with over $ 2 trillion in daily turnover and at the same time has the least drawdowns, I wanted to continue trading in the Forex market.
So I tried to find another way. I started organizing my forex trading based only on the futures data. Initially, this was a very daring version, especially since it was a matter of two different markets. It didn't work so well at first because I didn't pay attention to some things. However, it was an alternative that gave me the motivation to take a closer look at the volume. A big aspect benefited me. For years I have been dealing intensively with the approach of big players and high-frequency traders. If you want to be really successful in this market, you cannot avoid it. I started to deal more intensively with the footprint chart, volume chart and market profile. That didn't get me anywhere. The next step was the DOM and the Times and Sales list. This information was much more accurate, but I was still on the wrong track. I returned to the big players' way of working and started to deal with them in more detail. The big players move the market, that is undisputed, but how do they move the market? Let's start with that.
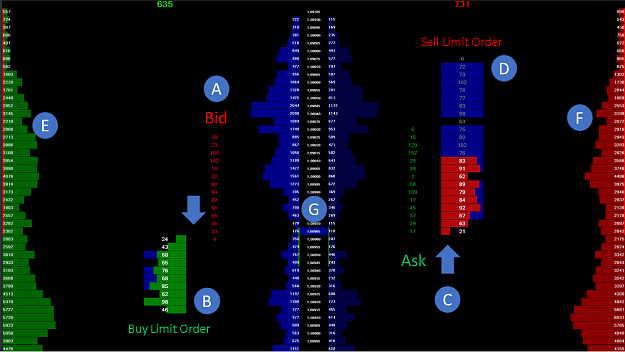
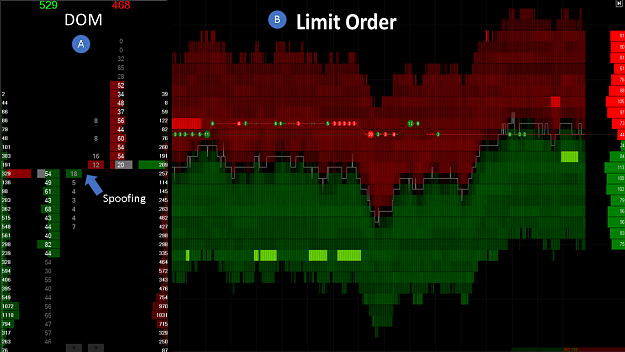
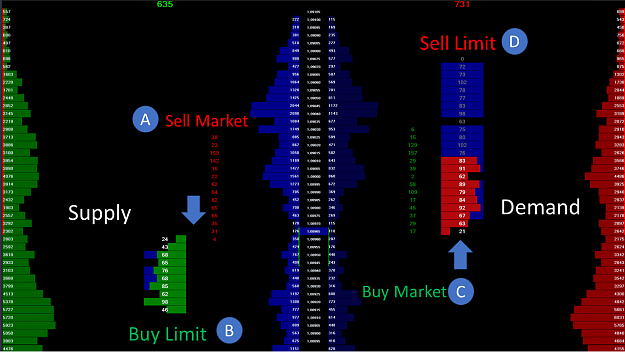
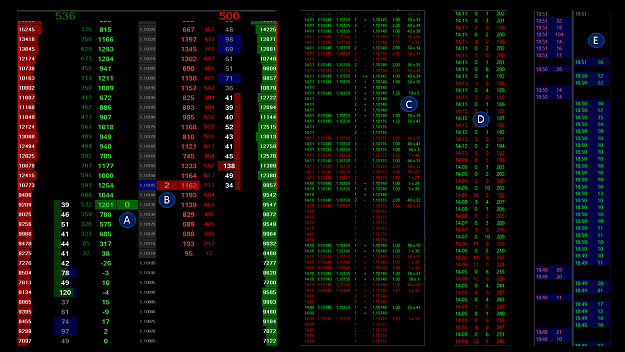
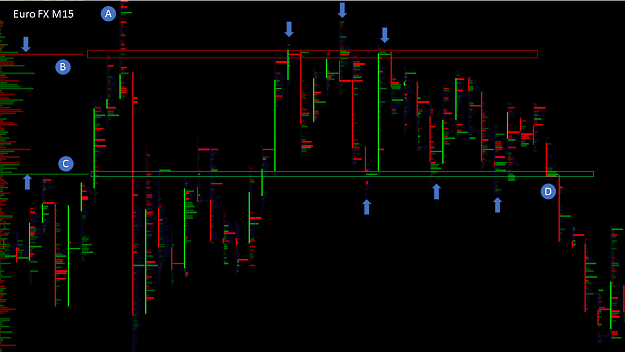
At point A the sell market orders come into the market, which meet the buy limit orders at point B. At point C the buy market orders come into the market that meet the sell limit orders point D. At Point E we see the monthly volume of buy market orders and at Point F the monthly volume of sell market orders. Point G shows the price, the daily volume and the number of trades at the respective price level. You can add other ads to this DOM, such as spoofing, which shows added or deleted limit orders. For our example, I did without it. The market orders eat their way into the limit orders and as soon as the liquidity is used up, it goes to the next price level. If many market orders come in, but the price does not change, the market orders are held up by the limit orders. This means that more and more limit orders are added at this price level, one speaks of an absorption.
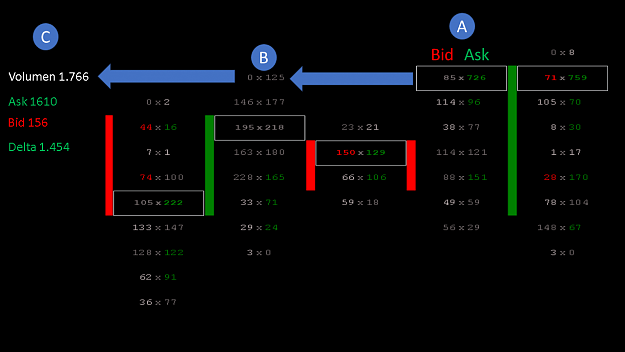
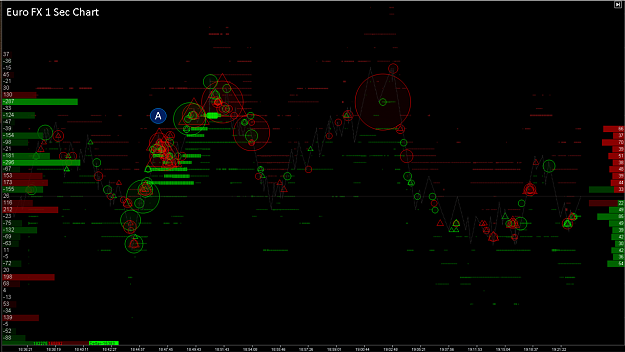
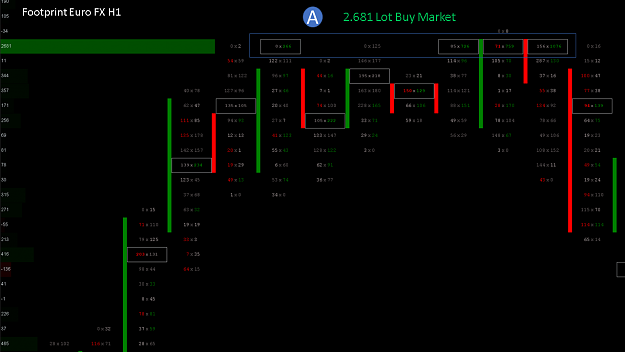
A footprint chart is a concrete representation of the DOM in the area of market orders. The time frame is specified by the dealer. At Point A we see such a footprint representation. The ask or the market buy orders are on the right, the bid or the market sell orders are on the left. The white frame indicates the highest volume in the candle. 726 lots were traded on the ask side, while 85 lots were traded on the bid side.
At Point B, a beginner's first question comes to mind: how can it be that 125 lot market buy and only 0 lot market sell were traded at one price level? First of all, we need to know that the market buy orders and market sell orders can never meet eachother. The market sell orders meet the limit buy orders and the brand buy orders meet the limit sell orders. Therefore, a footprint chart is a bit confusing at first, because the market buy orders and market sell orders stand side by side. It is just a representation of how much lot was traded at a price level. The red and green numbers each show an imbalance of the individual market orders. Although this is an interesting note, I would not make any trading decisions with it.
At Point C we see the total volume that was traded at the upper price level. This is a total of 1766 lots. 1610 lots were traded in ask and 156 lots in bid. Ask minus Bid is delta, in our case a positive delta of 1454 Lot. These are exclusively market orders. So we can initially state that only the market orders are able to move the market, while the limit orders are able to stop the market. Since the big players move the market, one could conclude that the big players primarily deal with market orders. However, this is a false assumption, which I will discuss in more detail. The vast majority of price representations primarily refer to market orders, only in the DOM and in the heat map can limit orders be displayed at first glance.
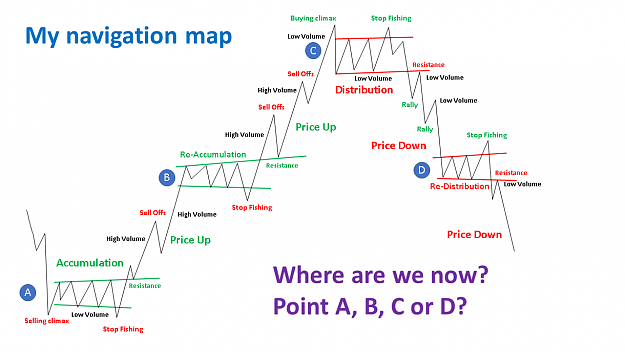
As we have already established, the big players are not able to immediately get large orders in the market and then push the price in their direction. Therefore, they are sometimes forced to collect Ask or Bid over several days within certain price levels and then push the price towards them. For me, these are the so-called equilibrium phases, which are shown here with accumulation and distribution. During these phases, the big players have the task of collecting ask or bid and at the same time always keeping the price within this range. Before the breakout, you have to stop potential followers to avoid being delayed in your breakout.
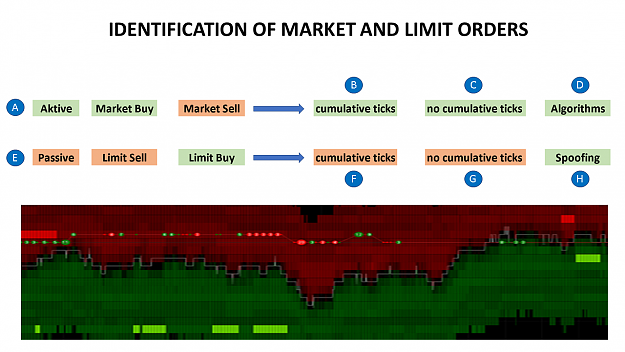
The big question now is how a big player can best collect within an accumulation or distribution phase without most market participants noticing. We know that market orders are visible in the market, while limit orders cannot be identified. For this reason, iceberg orders are primarily used for these collection campaigns. Iceberg orders are nothing more than limit orders, which are controlled by algorithms and absorb market orders at certain price levels. We should know that absorption does not take place at one price level, but always at several.
Let's imagine a big player wants to push a price down, which means we are in a distribution phase. To do this, he first has to collect bids, so in the area of sell limit orders the algorithms are instructed to buy a certain number of market buy orders without giving themselves away. This means big players have to be careful not to absorb too much at one level, otherwise the market could quickly realize that this is a strong resistance level and many traders would take long positions. When a big player collects limit orders within an equilibrium, it is a lot of work at first. The price has to be kept within the range, stops have to be started because there is immediate volume available and if enough has been collected, a suitable time has to be selected at which the volatility may be somewhat higher.
In these actions, the employed traders of the big players must work together, to work towards a common goal. Different traders get the order to collect a predetermined number of limit orders at different price levels using different algorithms. As soon as they have completed their collection campaign and have initially pushed the course in an opposite direction to trigger the stops of the followers, the algorithms begin to push the course upwards. This takes the form of cumulative small market orders that the market initially does not notice. I have observed these algorithms in the last few months and it is relatively easy to read them. We will deal with this in more detail, however. Stophunting is also a crucial factor for big players. Possible stops are easiest to identify in the Forex market, since we have 5 times more accurate price positions there than in the Future market.
First of all, I divided the big players and retail traders according to supply and demand. The demand comes within an accumulation phase and the supply within a distribution phase. Let us first consider how the individual market participants behave in the individual phases.
Within an accumulation phase, a big player needs Ask, which he tries to collect with limit buy orders. For this he has to buy the euro and it is a passive order, as this does not move the market. Within an accumulation phase there is a so-called range in which the big player collects ask. As soon as the price moves extremely out of this range, the big player is forced to push the price back into this range. At the low of this range, he has to buy the euro with buy market orders in order to push the price up again. At the high of this range, he has to buy the dollar to push the price down again.
Once he has collected enough, the crucial question is whether the majority of the participants are short or long in the market. If many participants have taken a long position, there will be a stophunting. To do this, the big player must first buy the dollar heavily in order to push the price down. On the way down, the long trader's first stops begin to burst. He has to intercept these stops with buy limit orders. As soon as he suspects no further stops, he starts selling the dollar. This sale releases a high number of ask and pushes the price up. In addition, it will push the price up in the form of cumulative market buy orders. The price upwards in zigzags, the background to this is that the big player needs new volume again and again to bring the price up further. For this he uses the stops of the retail traders.
Because the price continues to rise, there are more and more retail traders joining a long trade. As soon as the volume has reached a corresponding size, the big player begins to exit the euro with limit sell orders. Since this is done with limit orders, most market participants do not notice that the big player is already getting out. If the price does not reach the limit orders of the big players, they can of course also exit the market with markets sell orders. However, this is perceived by the market and could immediately trigger a turnaround. Then the big player would have problems getting out of his position. During the distribution phase, the opposite is true, as you can see on the table.
Since a retail trader can enter the market directly but does not move the price, his trading activities are also restricted accordingly. In most cases, beginners focus exclusively on market orders for entry and exit, with a take profit belonging to the category of limit orders. As soon as a retail trader is stopped, a respective market order is released. In order for the big players to intercept these stops, they are forced to place limit orders in the market.
Here I have now compared the big players and the retail traders in the accumulation and distribution phase. If a big player wants to collect ask in an accumulation phase, he has to buy the euro. In return, he needs a retail trader who either buys the dollar or sells the euro. With its buy limit orders, the big player intercepts the market orders of the retail traders. In order to understand the market context exactly, I recommend that you first deal with these two tables in detail. It is also important to recognize in the market whether a big player is currently buying the dollar or selling the euro. In both cases, Bid come in the market, but there is a crucial difference.
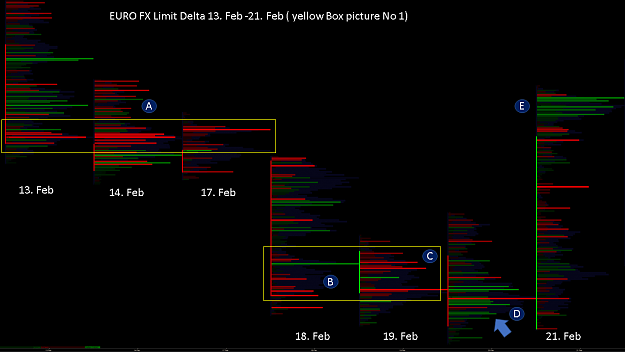
In the picture we see two volume profiles from two different days in the Euro FX. The volume is the addition of bid and ask. There are many trainers who swear by this volume profile and use it to make concrete trading decisions. For me, this is only a representation to determine in which price ranges a stronger struggle between the different market participants has taken place. Deriving specific resistance zones for the future from this is more realistic than an RSI or MACD, but the decisive factor for me is who won in the individual price ranges. And this cannot be clearly determined in a volume profile. Of course, one could now say that the market tried to keep the price high and then failed and therefore the price went down. In my opinion, however, this is a vague statement that can usually only be made once the course has already been completed. As I said, this view is interesting to determine, in which area an increased volume took place, but not more.
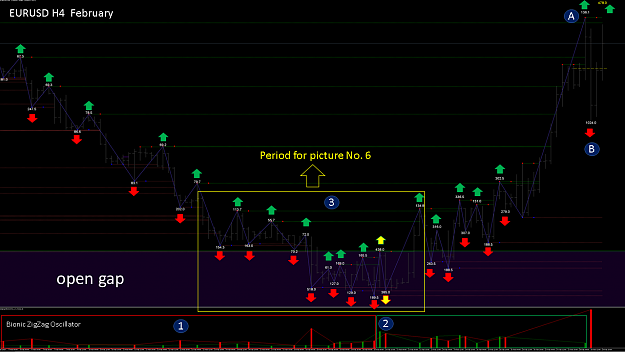
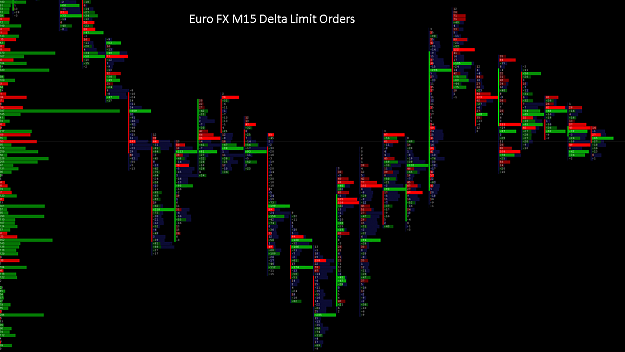
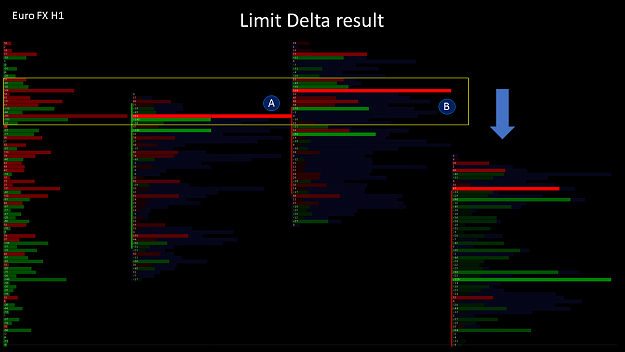
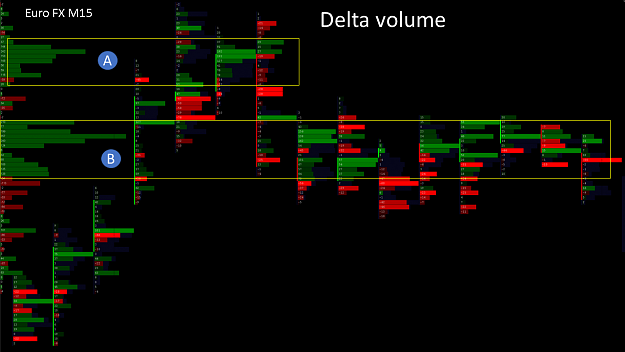
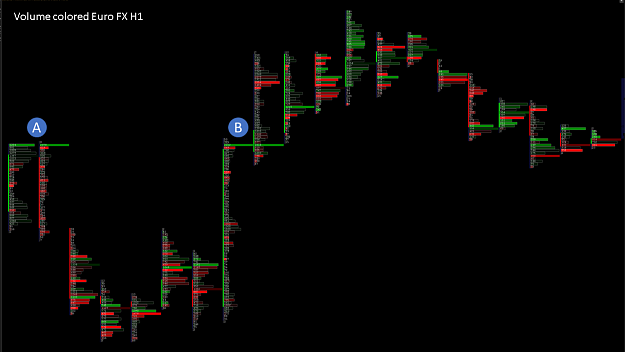
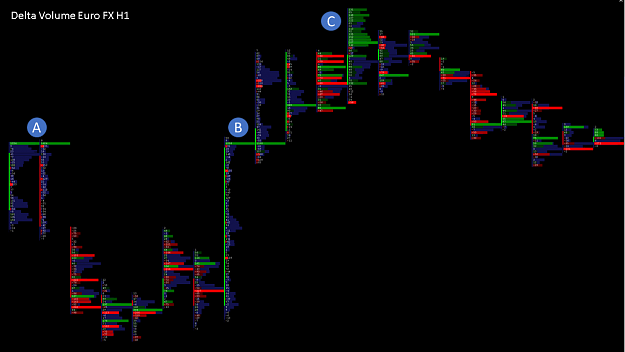
In this picture we now see a delta of market orders. As we know, the delta is the result of ask and bid. If we see a green bar, more ask than bid was traded on the price level, if we see a red bar, more bid than ask was traded on the price level. If we only looked at the day candle at Point A and had to make a decision about where the price would go next, many would assume that the price would tend to go up. At point B, the price went down and we see that a lot of Ask was traded on the lower three levels. This could be an indication, that the price will now up again. The opposite was the case, however, because the price after go down sharply. So we find that the market orders that move the market do not appear to be an indicator of a long-term price trend.
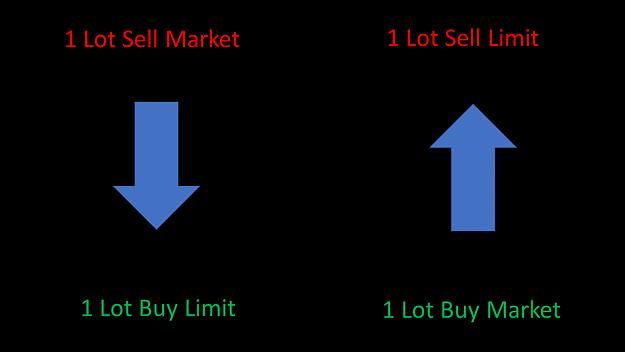
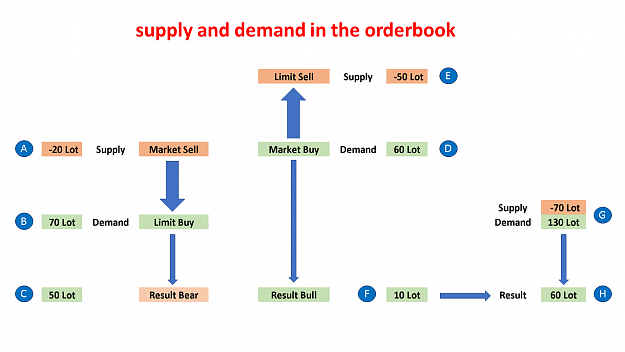
Let us briefly recall our first slide, the DOM. If we launch a 1 Lot Sell Market Order and it is activated, a 1 Lot buy limit order must be activated at the same time. We now have a buyer and a seller in the market. First of all, it should not be relevant whether the euro was bought or sold or whether the dollar was bought or sold. When a market buy order comes into the market, a sell limit order has to be activated at the same time. This means that a buyer can only meet one seller. If the market is just starting and a market buy order triggers a sell limit order, it means that both a buyer and a seller are in the market at that moment. And this is exactly the point that gave me the idea.
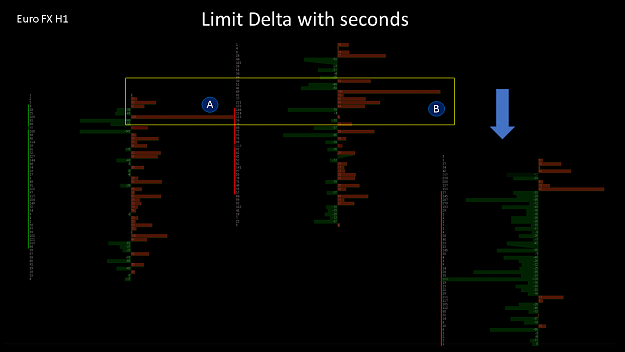
If a market buy order simultaneously triggers a limit sell order and a market sell order simultaneously a limit buy order, it is automatically possible to display the limit orders in the market. First you just have to swap the colors. So if a market buy order that is green meets a limit sell order that is red, I just have to swap the colors of Bid and Ask to make the limit order visible.
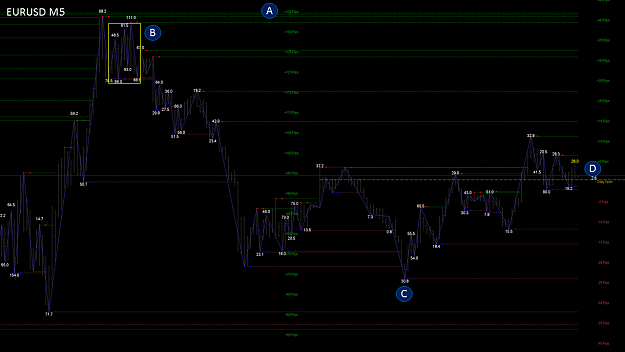
With this in mind, let's take another look at the first day candle at Point A. We now see a strong delta in the sell limit area. One could conclude from this that the price continues to fall. Also in the second day candle in the upper area, a stronger sell limit delta was created, which pushed the price down. A stronger sell limit delta was also created in the lower area of this day candle, which could justify a further price slide downwards. We have already noticed that while market orders move the market, limit orders determine where the market will go in the long term. With this approach, we have already taken a small step forward, but in principle no rule can be created from it that always applies 100%. The consideration of limit orders is always a long-term one, in addition one must also consider the short and medium-term range. For this we need certain tools from the future area, which we will deal later with in more detail.
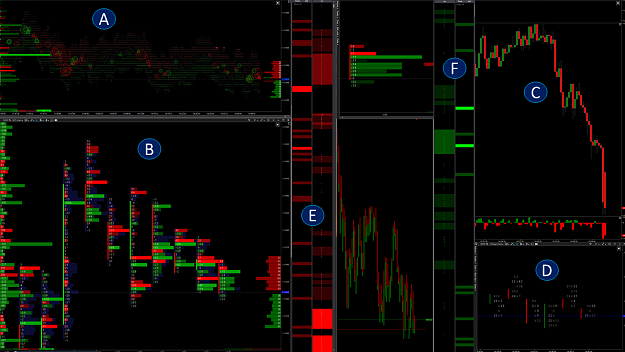
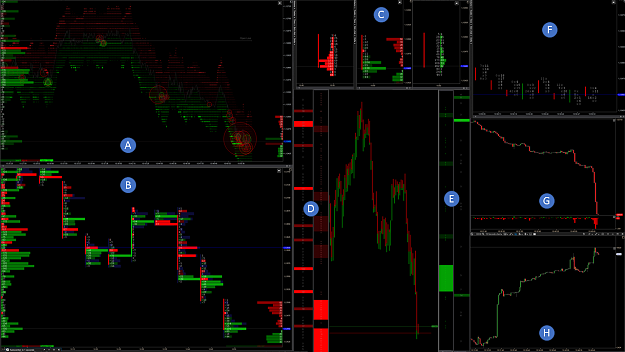
In the footprint chat at Point A we see the total volume on the left and on the right the number of trades that were entered into this price range. At Point B we see a volume chart that shows a filtered total volume. At Point C we see a total daily volume divided by bid and ask and at Point D the division of bid and ask within a single candle. In many trainers' seminars, the presentation of market orders is trained in order to make trading decisions. In the short and medium term this may be correct to a certain extent, but the market is primarily determined by the limits order. And exactly these limit orders are ignored.
In my last report, “Own liquidity for the big players”, I talked about two striking points, where the big players have provided themselves with liquidity. Here you can read the articles again.
Own liquidity for the big players
The Big Player bag of tricks
For all forex traders, at this point the price has only reached a resistance zone twice, nothing more. What is decisive, however, is what happened in the market at that moment and this information can only be obtained from the future market. So if you want to have comprehensive information in the future about what is currently happening in the market, you will inevitably have to deal with the future data. This does not mean that you cannot trade profitably with pure Forex data, but the probability is significantly less than with comprehensive information. But even the information from the future market does not help if you do not filter it properly and present it in such a way that it brings a concrete trading advantage. In our project number 10, in addition to the forex data, we will also deal intensively with the future data and combine them with one another. And exactly this combination will bring you a decisive trading advantage.
I wish you a great weekend
best regards
Michael
A completely new market view
Hello dear subscribers,
As promised, we are starting today with our new project No. 10. In this project we will see that the limit orders are more crucial for the long-term price trend than the market orders. And I will show you how to make limit orders visible. In the next few weeks we will deal with the future data in more detail. Our project no. 9 (Stophunting) will continue to accompany us. If you want to be successful in this market in the long term, you need to take a closer look, how big players work. A price does not change because a moving average has crossed, an RSI is overbought or a fibozone has been reached, but because there are more short traders than long traders in a downward movement and more long traders than short traders in an upward movement. The big players determine the market and they pursue a goal. This goal can only be recognized if you know what they are up to. Their plan can be identified by the limit orders. We want to start with that today.
In the past 10 years I was lucky enough to take the smaller movements up to 10 pip within one equilibrium and was therefore able to act profitably. However, I was unlucky enough to never know exactly what was happening in the market. FF motivated me to write down my thoughts on trading over 2 years ago. At first I tried to describe my approach exactly and quickly realized that this is not so easy. The more I wrote, the more questions I had. Every question I answered myself took me a step further, but more and more questions came up and prompted me to dig deeper into the subject. With the tick charts, a kind of breakthrough came into the world of stock market data. At first I wanted to know exactly how these tick charts are calculated in Forex and at the same time I recognized the incompleteness and limitation of this calculation. Many years ago I heard about the volume that was presented with footprint charts, volume profile and market profile. But all these chart representations make no sense in Forex, since no data feeds are provided for them. Why deal with something that is not feasible.
First of all, I wanted to know how a tick chart in Forex differs from a tick chart in Future. So I got futures data, but these pure futures data alone couldn't give me a clear answer. The MT5 was the worst alternative to optimally display futures data, as well as other trading platforms such as Ninja Trader, Multicharts, Sierra Chart or Jigsaw could not satisfy my requirements. I chose a professional proprietary trading platform. This enabled me to filter and display the pure stock market data in such a way that it made sense to me. I started to compare the tickchart in the forex with the tickchart in the future. It struck me that the course behaved almost exactly the same, but the prices were different due to the swaps. I am one of the 4% of professional Forex traders in Europe who can trade up to 400 with a lever and at the same time I have extremely good protection in the event of an uncontrolled breakout. Since the EURUSD has the highest liquidity in the Forex market with over $ 2 trillion in daily turnover and at the same time has the least drawdowns, I wanted to continue trading in the Forex market.
So I tried to find another way. I started organizing my forex trading based only on the futures data. Initially, this was a very daring version, especially since it was a matter of two different markets. It didn't work so well at first because I didn't pay attention to some things. However, it was an alternative that gave me the motivation to take a closer look at the volume. A big aspect benefited me. For years I have been dealing intensively with the approach of big players and high-frequency traders. If you want to be really successful in this market, you cannot avoid it. I started to deal more intensively with the footprint chart, volume chart and market profile. That didn't get me anywhere. The next step was the DOM and the Times and Sales list. This information was much more accurate, but I was still on the wrong track. I returned to the big players' way of working and started to deal with them in more detail. The big players move the market, that is undisputed, but how do they move the market? Let's start with that.
Attached Image (click to enlarge)
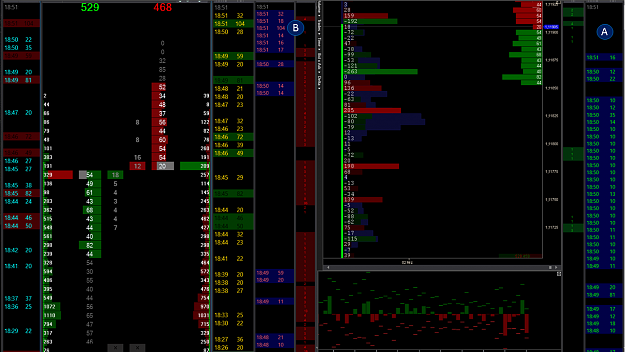
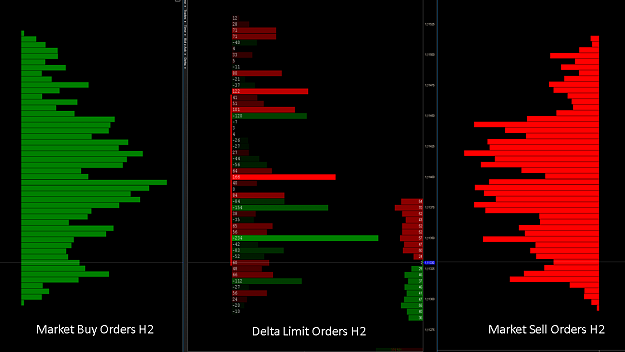
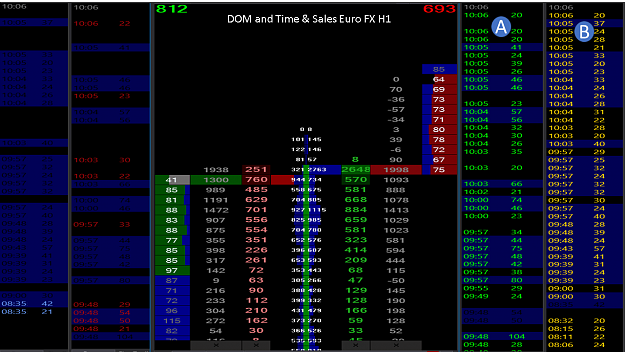
At point A the sell market orders come into the market, which meet the buy limit orders at point B. At point C the buy market orders come into the market that meet the sell limit orders point D. At Point E we see the monthly volume of buy market orders and at Point F the monthly volume of sell market orders. Point G shows the price, the daily volume and the number of trades at the respective price level. You can add other ads to this DOM, such as spoofing, which shows added or deleted limit orders. For our example, I did without it. The market orders eat their way into the limit orders and as soon as the liquidity is used up, it goes to the next price level. If many market orders come in, but the price does not change, the market orders are held up by the limit orders. This means that more and more limit orders are added at this price level, one speaks of an absorption.
Attached Image (click to enlarge)
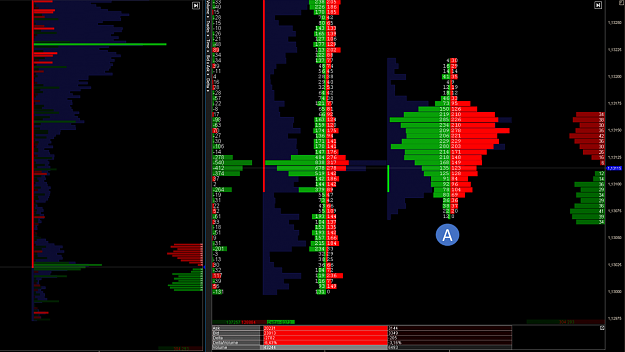
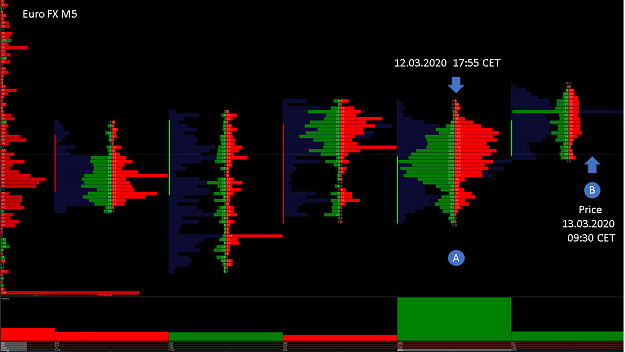
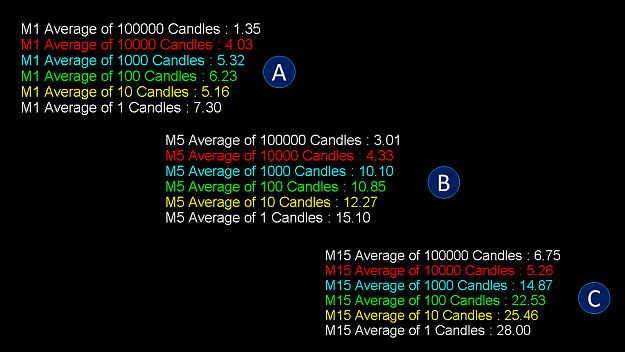
A footprint chart is a concrete representation of the DOM in the area of market orders. The time frame is specified by the dealer. At Point A we see such a footprint representation. The ask or the market buy orders are on the right, the bid or the market sell orders are on the left. The white frame indicates the highest volume in the candle. 726 lots were traded on the ask side, while 85 lots were traded on the bid side.
At Point B, a beginner's first question comes to mind: how can it be that 125 lot market buy and only 0 lot market sell were traded at one price level? First of all, we need to know that the market buy orders and market sell orders can never meet eachother. The market sell orders meet the limit buy orders and the brand buy orders meet the limit sell orders. Therefore, a footprint chart is a bit confusing at first, because the market buy orders and market sell orders stand side by side. It is just a representation of how much lot was traded at a price level. The red and green numbers each show an imbalance of the individual market orders. Although this is an interesting note, I would not make any trading decisions with it.
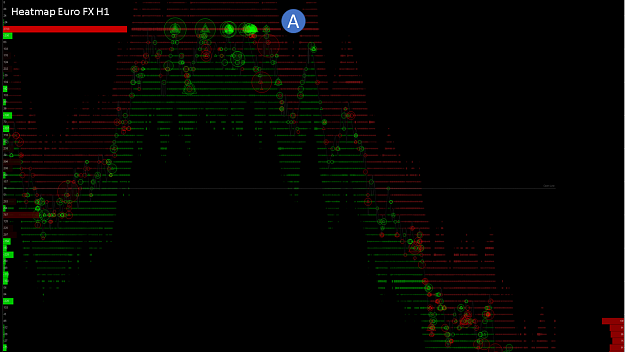
At Point C we see the total volume that was traded at the upper price level. This is a total of 1766 lots. 1610 lots were traded in ask and 156 lots in bid. Ask minus Bid is delta, in our case a positive delta of 1454 Lot. These are exclusively market orders. So we can initially state that only the market orders are able to move the market, while the limit orders are able to stop the market. Since the big players move the market, one could conclude that the big players primarily deal with market orders. However, this is a false assumption, which I will discuss in more detail. The vast majority of price representations primarily refer to market orders, only in the DOM and in the heat map can limit orders be displayed at first glance.
Attached Image (click to enlarge)
As we have already established, the big players are not able to immediately get large orders in the market and then push the price in their direction. Therefore, they are sometimes forced to collect Ask or Bid over several days within certain price levels and then push the price towards them. For me, these are the so-called equilibrium phases, which are shown here with accumulation and distribution. During these phases, the big players have the task of collecting ask or bid and at the same time always keeping the price within this range. Before the breakout, you have to stop potential followers to avoid being delayed in your breakout.
The big question now is how a big player can best collect within an accumulation or distribution phase without most market participants noticing. We know that market orders are visible in the market, while limit orders cannot be identified. For this reason, iceberg orders are primarily used for these collection campaigns. Iceberg orders are nothing more than limit orders, which are controlled by algorithms and absorb market orders at certain price levels. We should know that absorption does not take place at one price level, but always at several.
Let's imagine a big player wants to push a price down, which means we are in a distribution phase. To do this, he first has to collect bids, so in the area of sell limit orders the algorithms are instructed to buy a certain number of market buy orders without giving themselves away. This means big players have to be careful not to absorb too much at one level, otherwise the market could quickly realize that this is a strong resistance level and many traders would take long positions. When a big player collects limit orders within an equilibrium, it is a lot of work at first. The price has to be kept within the range, stops have to be started because there is immediate volume available and if enough has been collected, a suitable time has to be selected at which the volatility may be somewhat higher.
In these actions, the employed traders of the big players must work together, to work towards a common goal. Different traders get the order to collect a predetermined number of limit orders at different price levels using different algorithms. As soon as they have completed their collection campaign and have initially pushed the course in an opposite direction to trigger the stops of the followers, the algorithms begin to push the course upwards. This takes the form of cumulative small market orders that the market initially does not notice. I have observed these algorithms in the last few months and it is relatively easy to read them. We will deal with this in more detail, however. Stophunting is also a crucial factor for big players. Possible stops are easiest to identify in the Forex market, since we have 5 times more accurate price positions there than in the Future market.
Attached Image (click to enlarge)
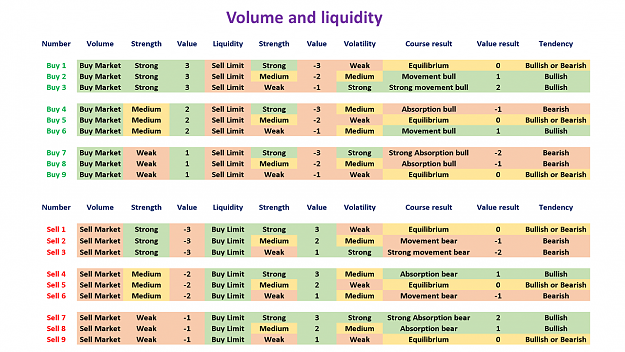
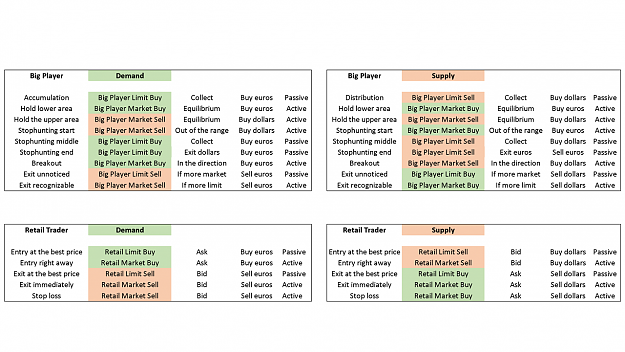
First of all, I divided the big players and retail traders according to supply and demand. The demand comes within an accumulation phase and the supply within a distribution phase. Let us first consider how the individual market participants behave in the individual phases.
Within an accumulation phase, a big player needs Ask, which he tries to collect with limit buy orders. For this he has to buy the euro and it is a passive order, as this does not move the market. Within an accumulation phase there is a so-called range in which the big player collects ask. As soon as the price moves extremely out of this range, the big player is forced to push the price back into this range. At the low of this range, he has to buy the euro with buy market orders in order to push the price up again. At the high of this range, he has to buy the dollar to push the price down again.
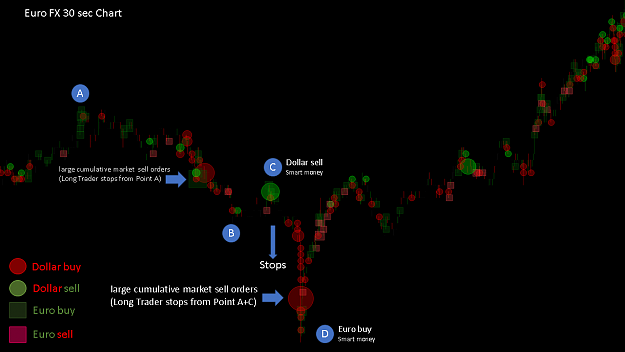
Once he has collected enough, the crucial question is whether the majority of the participants are short or long in the market. If many participants have taken a long position, there will be a stophunting. To do this, the big player must first buy the dollar heavily in order to push the price down. On the way down, the long trader's first stops begin to burst. He has to intercept these stops with buy limit orders. As soon as he suspects no further stops, he starts selling the dollar. This sale releases a high number of ask and pushes the price up. In addition, it will push the price up in the form of cumulative market buy orders. The price upwards in zigzags, the background to this is that the big player needs new volume again and again to bring the price up further. For this he uses the stops of the retail traders.
Because the price continues to rise, there are more and more retail traders joining a long trade. As soon as the volume has reached a corresponding size, the big player begins to exit the euro with limit sell orders. Since this is done with limit orders, most market participants do not notice that the big player is already getting out. If the price does not reach the limit orders of the big players, they can of course also exit the market with markets sell orders. However, this is perceived by the market and could immediately trigger a turnaround. Then the big player would have problems getting out of his position. During the distribution phase, the opposite is true, as you can see on the table.
Since a retail trader can enter the market directly but does not move the price, his trading activities are also restricted accordingly. In most cases, beginners focus exclusively on market orders for entry and exit, with a take profit belonging to the category of limit orders. As soon as a retail trader is stopped, a respective market order is released. In order for the big players to intercept these stops, they are forced to place limit orders in the market.
Attached Image (click to enlarge)
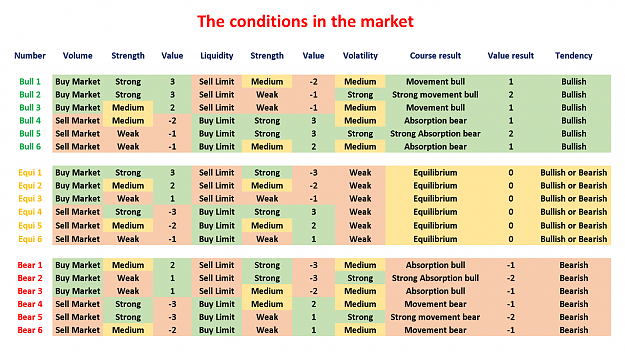
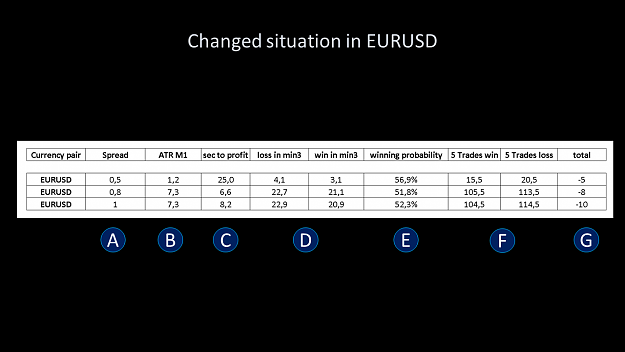
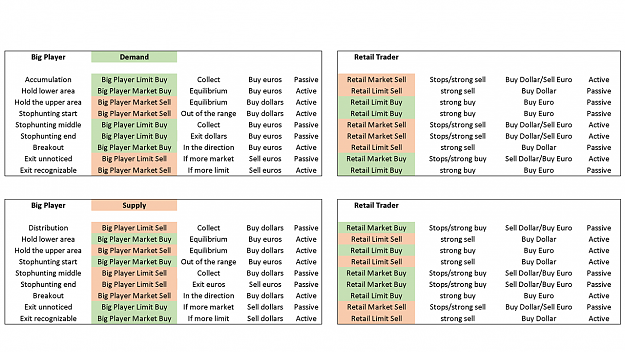
Here I have now compared the big players and the retail traders in the accumulation and distribution phase. If a big player wants to collect ask in an accumulation phase, he has to buy the euro. In return, he needs a retail trader who either buys the dollar or sells the euro. With its buy limit orders, the big player intercepts the market orders of the retail traders. In order to understand the market context exactly, I recommend that you first deal with these two tables in detail. It is also important to recognize in the market whether a big player is currently buying the dollar or selling the euro. In both cases, Bid come in the market, but there is a crucial difference.
Attached Image (click to enlarge)
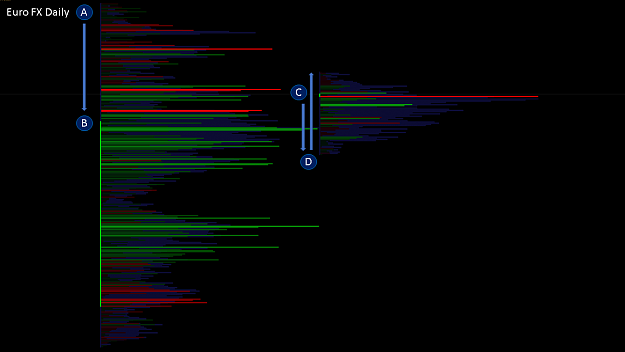
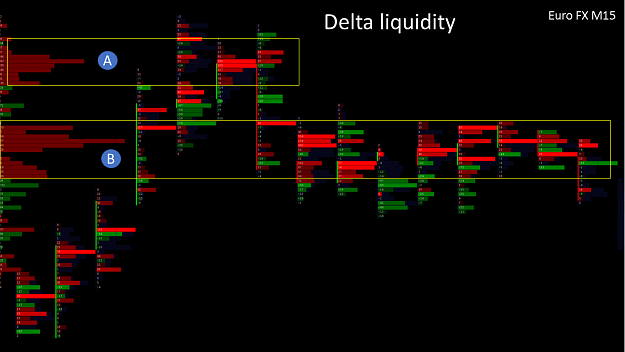
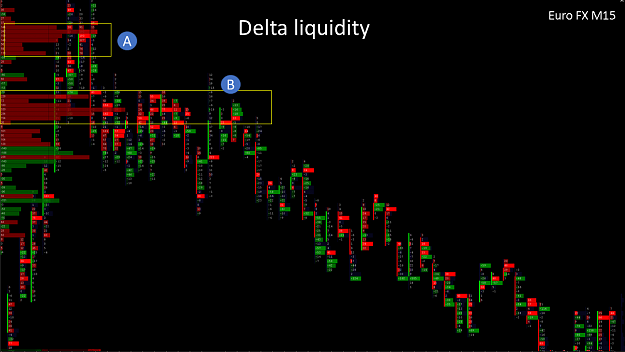
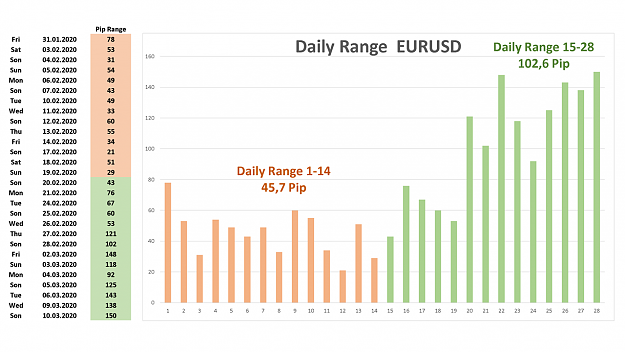
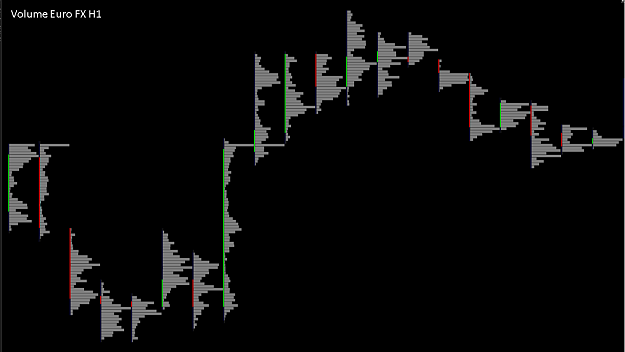
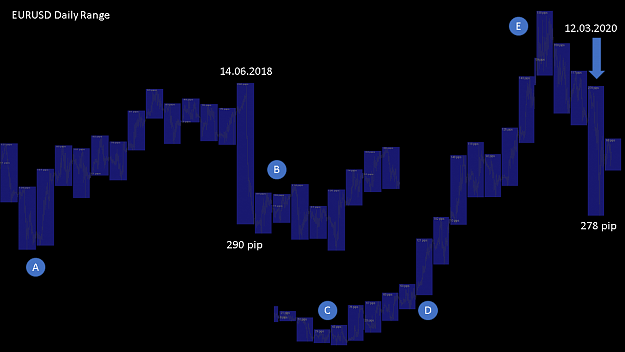
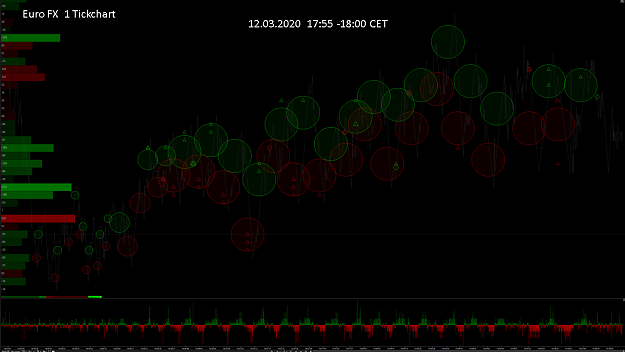
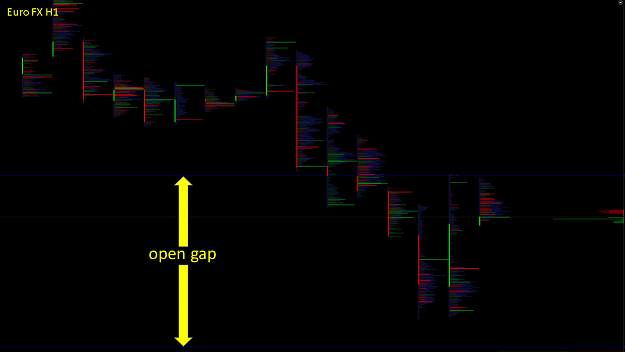
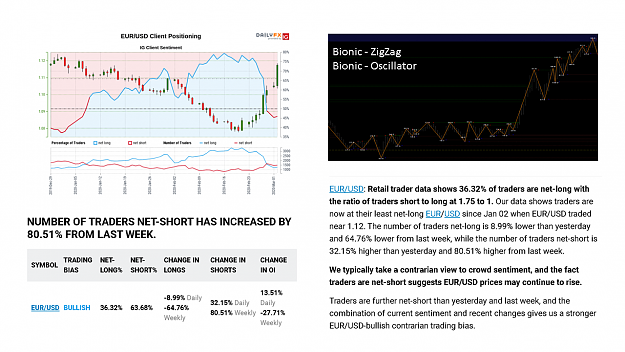
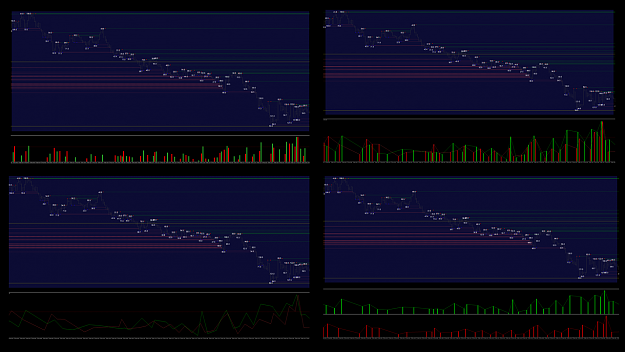
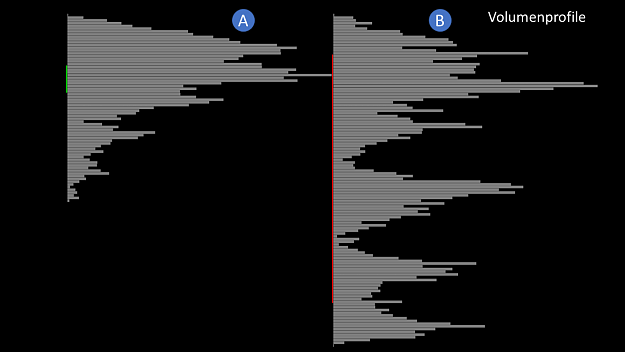
In the picture we see two volume profiles from two different days in the Euro FX. The volume is the addition of bid and ask. There are many trainers who swear by this volume profile and use it to make concrete trading decisions. For me, this is only a representation to determine in which price ranges a stronger struggle between the different market participants has taken place. Deriving specific resistance zones for the future from this is more realistic than an RSI or MACD, but the decisive factor for me is who won in the individual price ranges. And this cannot be clearly determined in a volume profile. Of course, one could now say that the market tried to keep the price high and then failed and therefore the price went down. In my opinion, however, this is a vague statement that can usually only be made once the course has already been completed. As I said, this view is interesting to determine, in which area an increased volume took place, but not more.
Attached Image (click to enlarge)
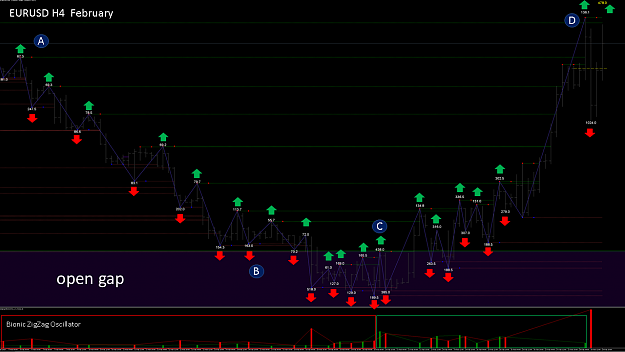
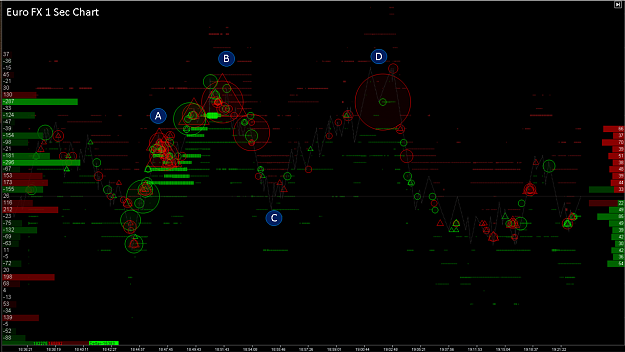
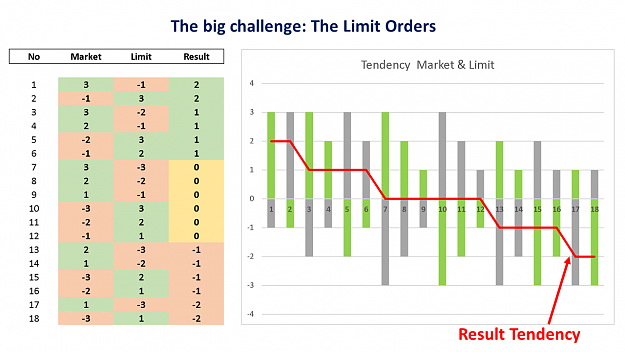
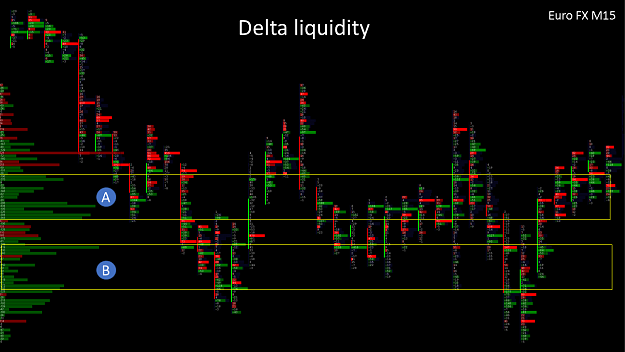
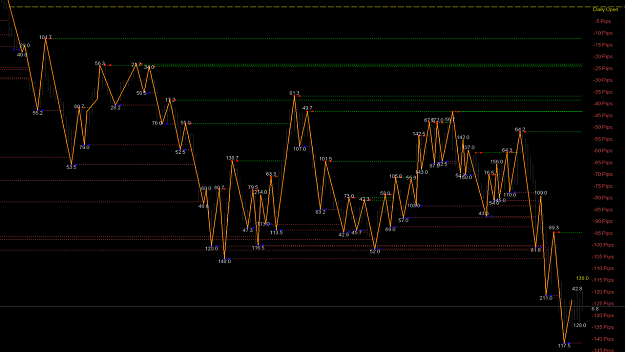
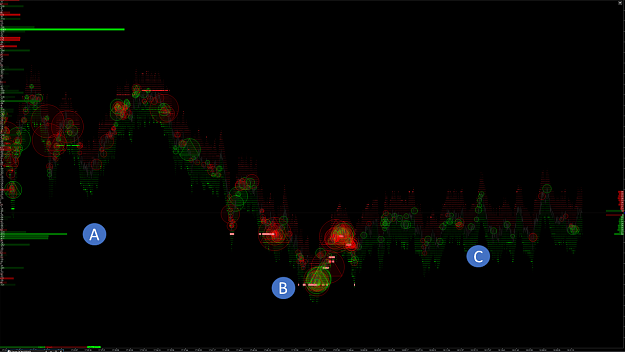
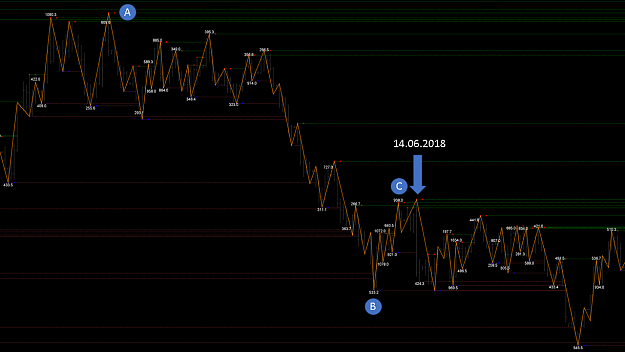
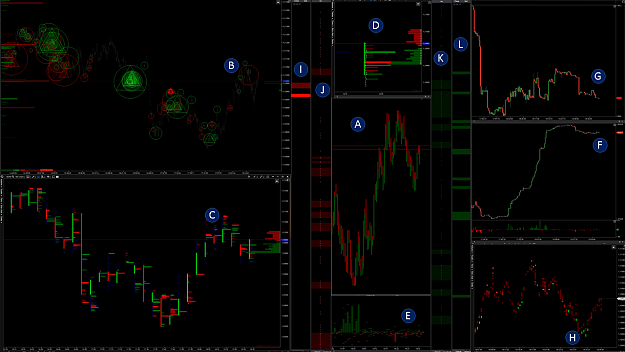
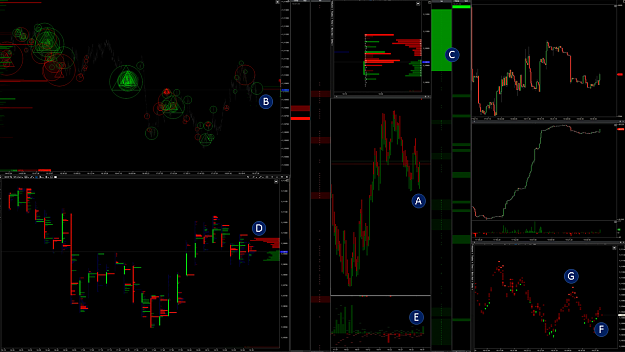
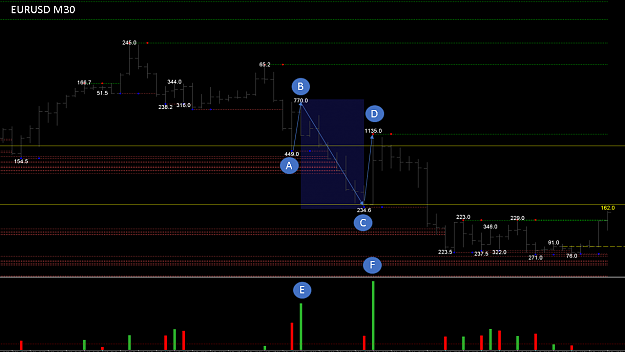
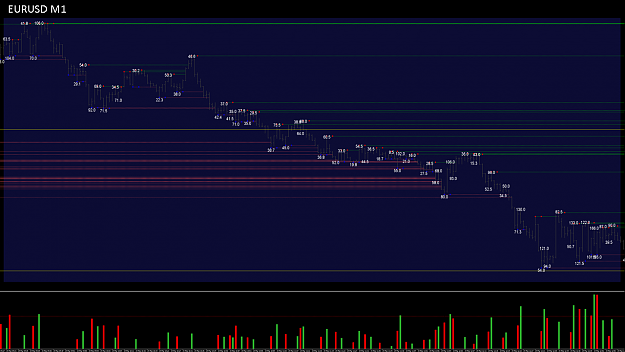
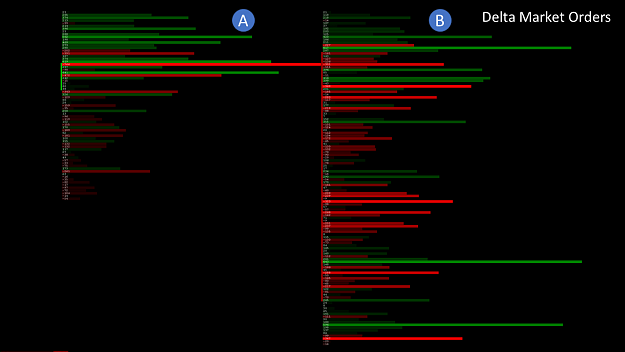
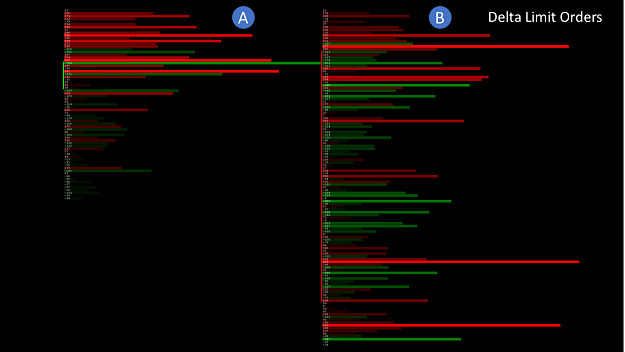
In this picture we now see a delta of market orders. As we know, the delta is the result of ask and bid. If we see a green bar, more ask than bid was traded on the price level, if we see a red bar, more bid than ask was traded on the price level. If we only looked at the day candle at Point A and had to make a decision about where the price would go next, many would assume that the price would tend to go up. At point B, the price went down and we see that a lot of Ask was traded on the lower three levels. This could be an indication, that the price will now up again. The opposite was the case, however, because the price after go down sharply. So we find that the market orders that move the market do not appear to be an indicator of a long-term price trend.
Attached Image (click to enlarge)
Let us briefly recall our first slide, the DOM. If we launch a 1 Lot Sell Market Order and it is activated, a 1 Lot buy limit order must be activated at the same time. We now have a buyer and a seller in the market. First of all, it should not be relevant whether the euro was bought or sold or whether the dollar was bought or sold. When a market buy order comes into the market, a sell limit order has to be activated at the same time. This means that a buyer can only meet one seller. If the market is just starting and a market buy order triggers a sell limit order, it means that both a buyer and a seller are in the market at that moment. And this is exactly the point that gave me the idea.
Attached Image (click to enlarge)
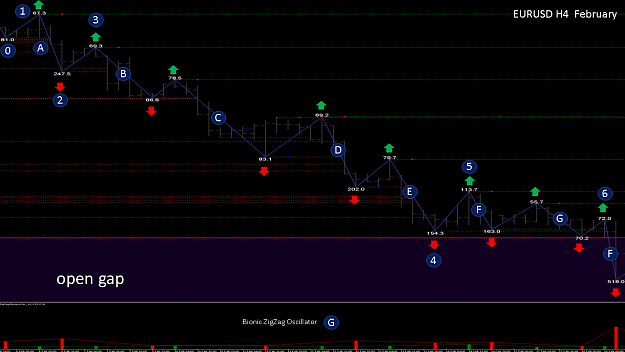
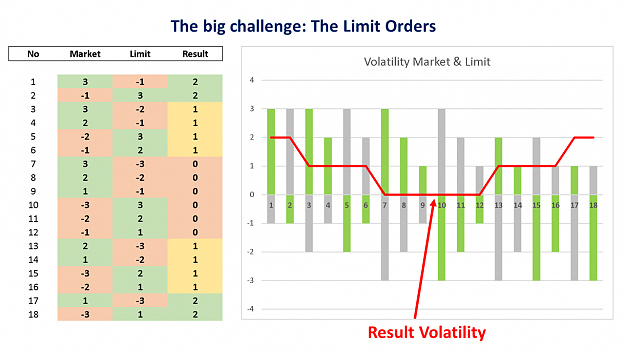
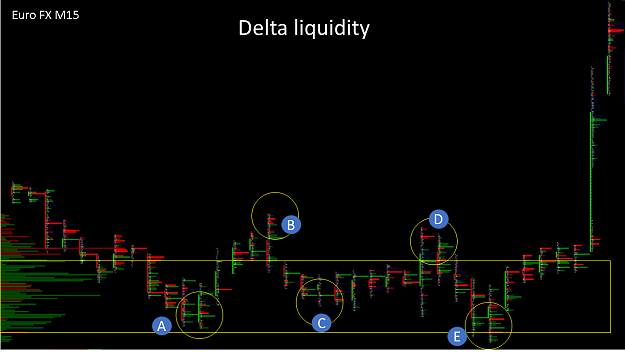
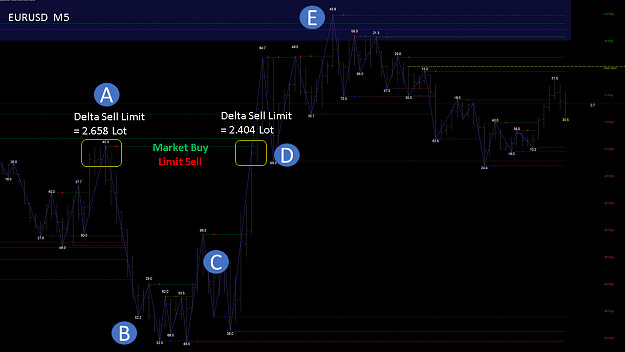
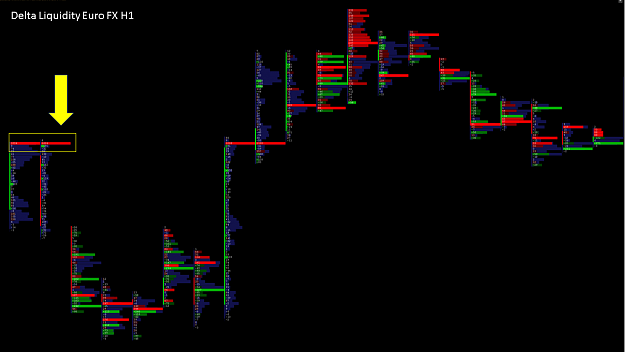
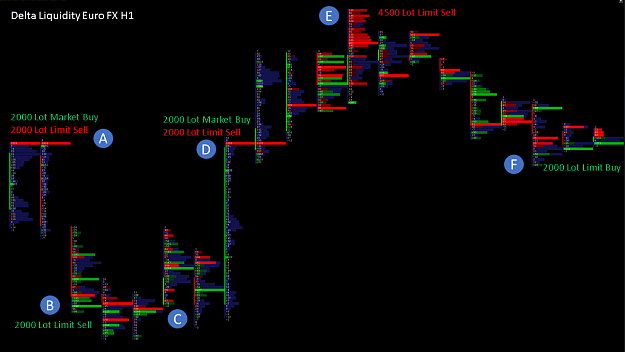
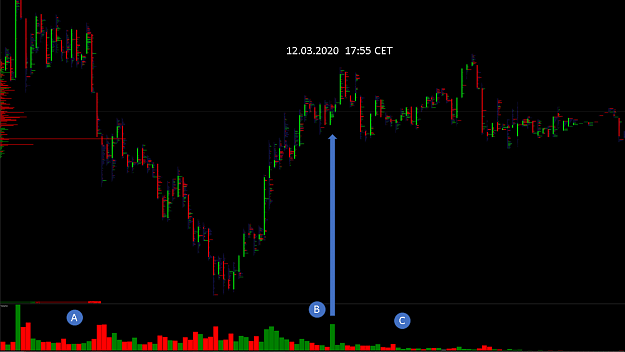
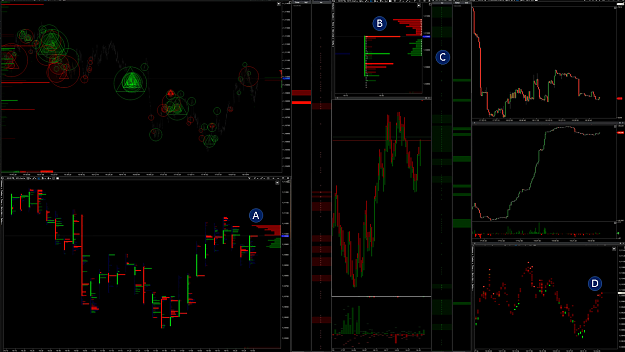
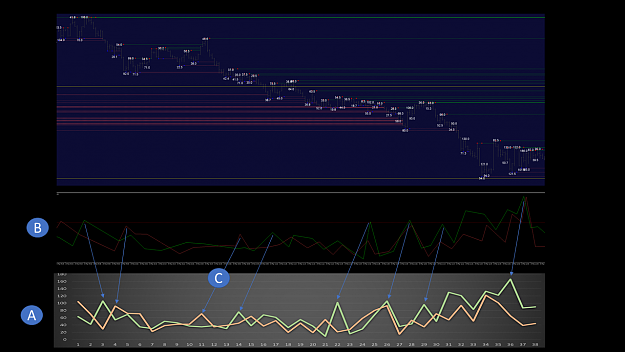
If a market buy order simultaneously triggers a limit sell order and a market sell order simultaneously a limit buy order, it is automatically possible to display the limit orders in the market. First you just have to swap the colors. So if a market buy order that is green meets a limit sell order that is red, I just have to swap the colors of Bid and Ask to make the limit order visible.
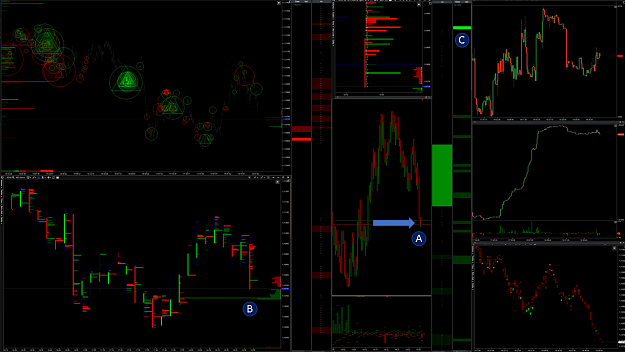
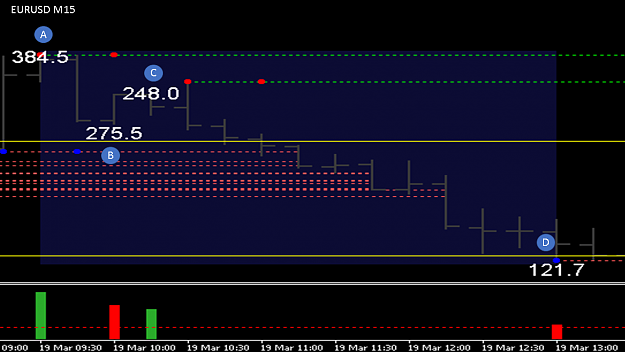
With this in mind, let's take another look at the first day candle at Point A. We now see a strong delta in the sell limit area. One could conclude from this that the price continues to fall. Also in the second day candle in the upper area, a stronger sell limit delta was created, which pushed the price down. A stronger sell limit delta was also created in the lower area of this day candle, which could justify a further price slide downwards. We have already noticed that while market orders move the market, limit orders determine where the market will go in the long term. With this approach, we have already taken a small step forward, but in principle no rule can be created from it that always applies 100%. The consideration of limit orders is always a long-term one, in addition one must also consider the short and medium-term range. For this we need certain tools from the future area, which we will deal later with in more detail.
Attached Image (click to enlarge)
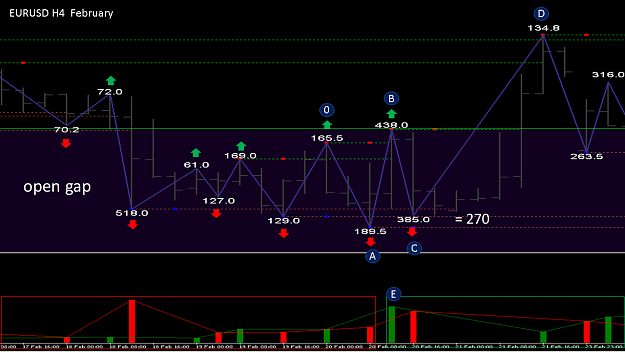
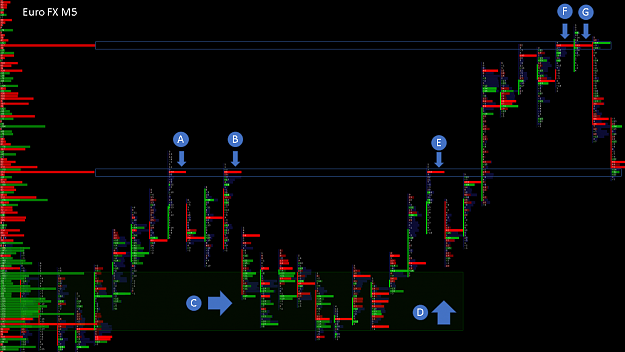
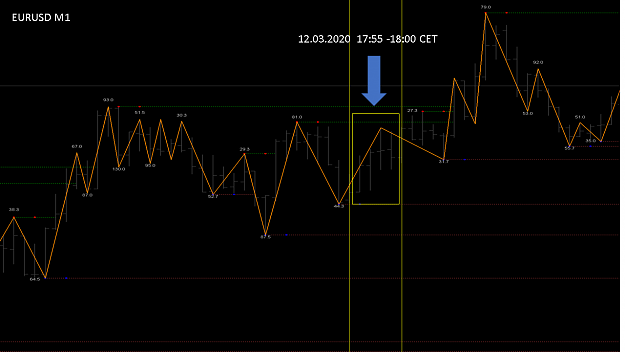
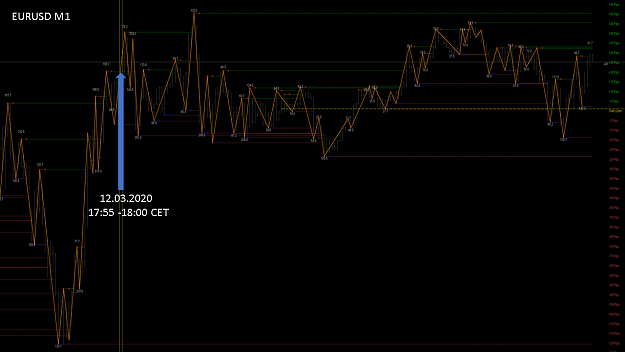
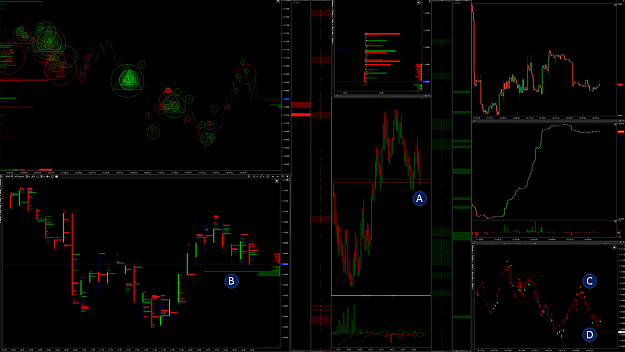
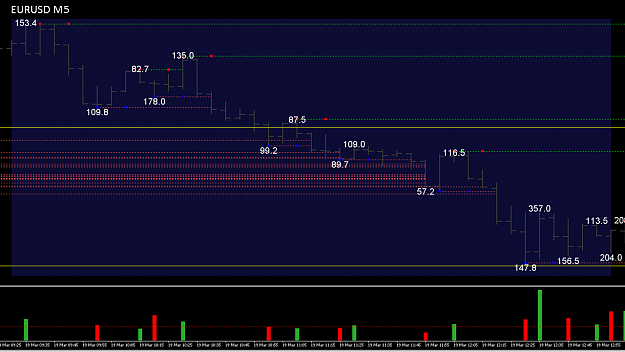
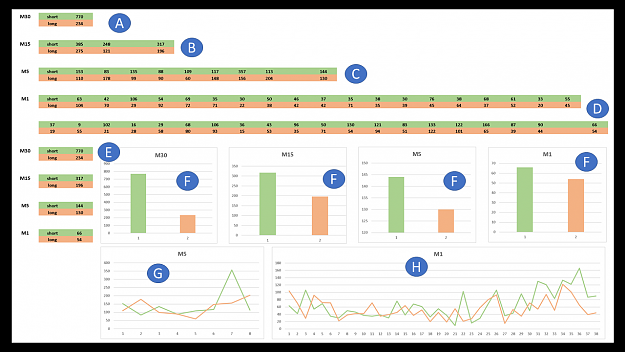
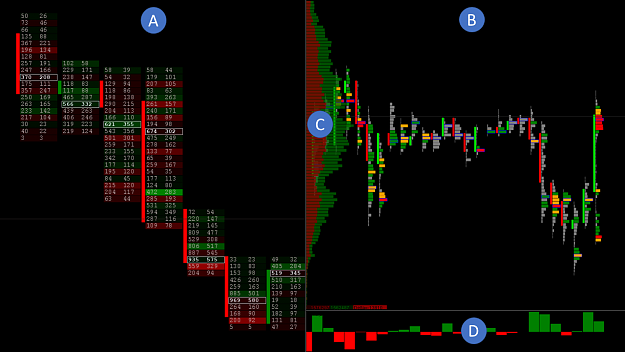
In the footprint chat at Point A we see the total volume on the left and on the right the number of trades that were entered into this price range. At Point B we see a volume chart that shows a filtered total volume. At Point C we see a total daily volume divided by bid and ask and at Point D the division of bid and ask within a single candle. In many trainers' seminars, the presentation of market orders is trained in order to make trading decisions. In the short and medium term this may be correct to a certain extent, but the market is primarily determined by the limits order. And exactly these limit orders are ignored.
In my last report, “Own liquidity for the big players”, I talked about two striking points, where the big players have provided themselves with liquidity. Here you can read the articles again.
Own liquidity for the big players
The Big Player bag of tricks
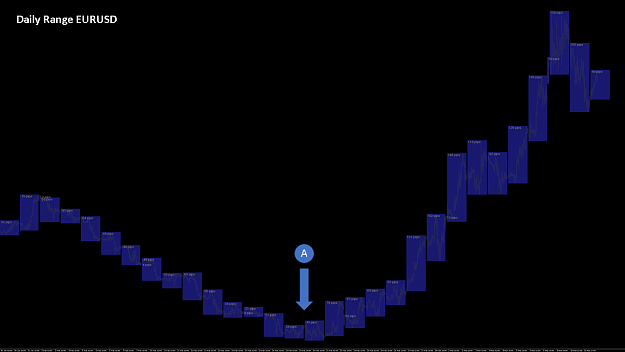
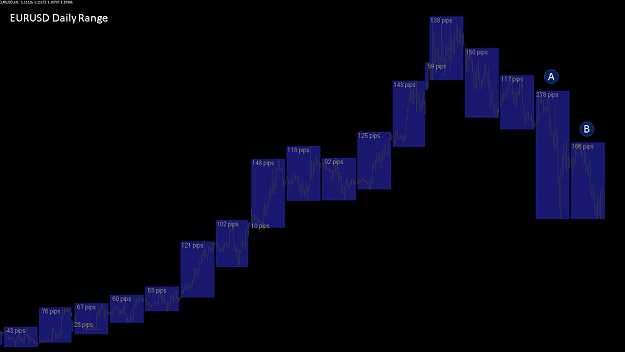
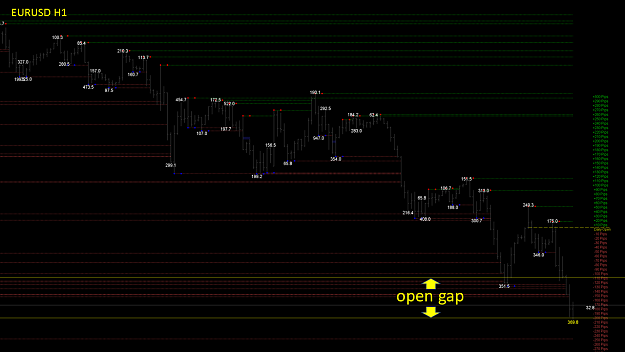
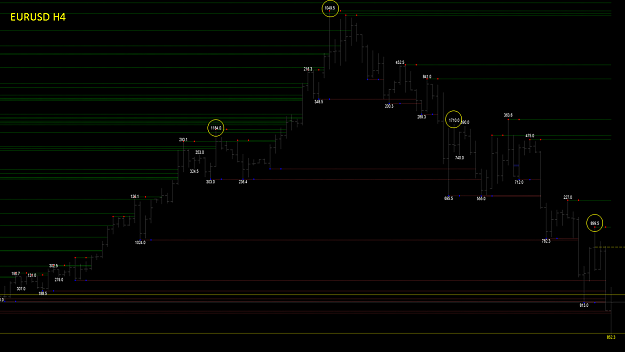
For all forex traders, at this point the price has only reached a resistance zone twice, nothing more. What is decisive, however, is what happened in the market at that moment and this information can only be obtained from the future market. So if you want to have comprehensive information in the future about what is currently happening in the market, you will inevitably have to deal with the future data. This does not mean that you cannot trade profitably with pure Forex data, but the probability is significantly less than with comprehensive information. But even the information from the future market does not help if you do not filter it properly and present it in such a way that it brings a concrete trading advantage. In our project number 10, in addition to the forex data, we will also deal intensively with the future data and combine them with one another. And exactly this combination will bring you a decisive trading advantage.
I wish you a great weekend
best regards
Michael
Forget:That does not work, amateurs build the ark, pros the Titanic!
8