I hesitate to go over historic charts and pick out stuff that "fits" my view of trading. Despite that I'm going to do a bit of that in an effort to better elucidate this "system". The PDF is in progress but given what I intend the PDF to be it will not be coming out quickly.
For anyone learning to trade any method I recommend lower time frame (LTF) charts to learn one's chosen strategy. Let me be clear that when I do use LTF charts I use them as they are and not as an entry method using multi time frame (MTF) analysis. I think I've stated before that I do not use MTF and will not discuss it in this thread.
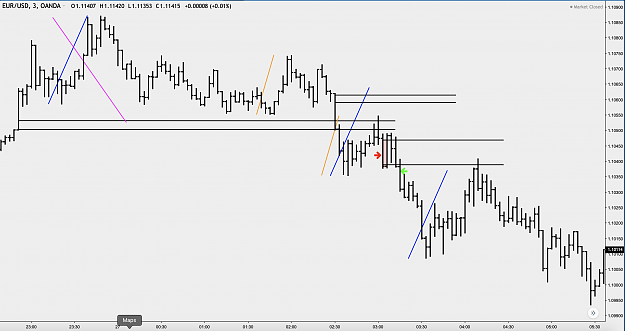
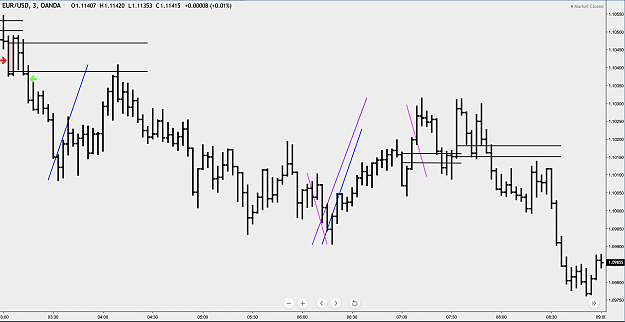
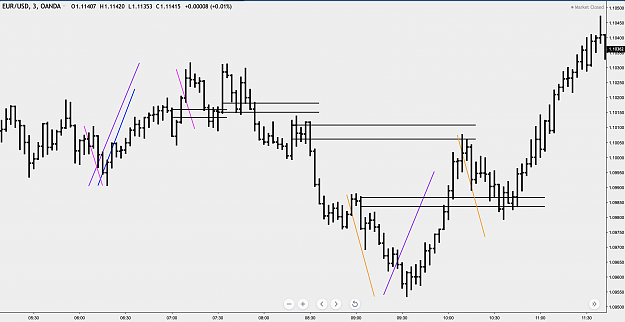
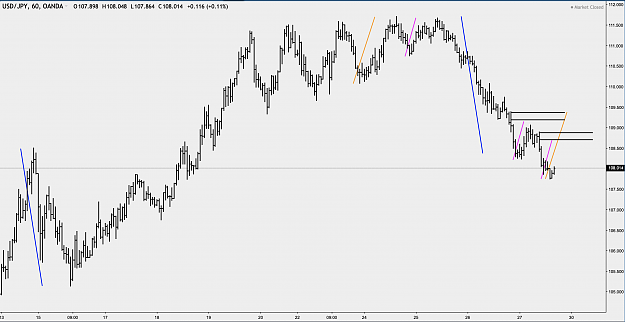
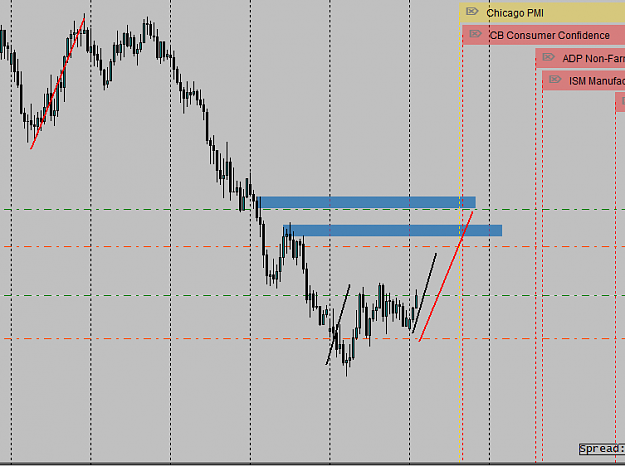
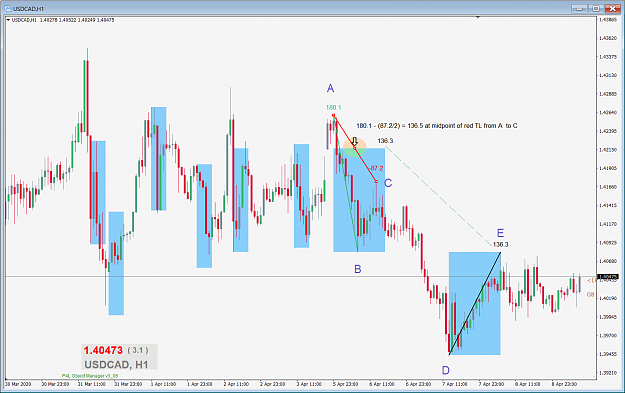
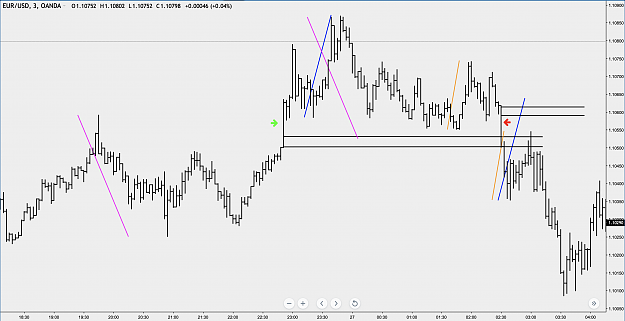
In the chart below the pink swings on the way up are shown. The green arrow points to a WRB gap signifying where significant buyers propelled price to new highs. The last blue impulse swing becomes the first corrective swing when price dips below it. Notice how price takes out the WRB gap (red arrow) powerfully. Now not the smaller orange swing and how that orange swing was projected as a corrective swing. The blue swing is also projected. When price fell below the red arrow buyers it is not too difficult to believe that some sort of retrace to that area is a place where one might consider a sell either at the orange projection or the blue projection. This is a personal decision.
Let me be clear that this is an obvious hind-sight example and will not always work. That's why we have stop losses.
I may take this further as there are some other good areas further ahead in time. Hope this is somewhat helpful for anyone confused.
For anyone learning to trade any method I recommend lower time frame (LTF) charts to learn one's chosen strategy. Let me be clear that when I do use LTF charts I use them as they are and not as an entry method using multi time frame (MTF) analysis. I think I've stated before that I do not use MTF and will not discuss it in this thread.
In the chart below the pink swings on the way up are shown. The green arrow points to a WRB gap signifying where significant buyers propelled price to new highs. The last blue impulse swing becomes the first corrective swing when price dips below it. Notice how price takes out the WRB gap (red arrow) powerfully. Now not the smaller orange swing and how that orange swing was projected as a corrective swing. The blue swing is also projected. When price fell below the red arrow buyers it is not too difficult to believe that some sort of retrace to that area is a place where one might consider a sell either at the orange projection or the blue projection. This is a personal decision.
Let me be clear that this is an obvious hind-sight example and will not always work. That's why we have stop losses.
I may take this further as there are some other good areas further ahead in time. Hope this is somewhat helpful for anyone confused.
Attached Image (click to enlarge)
1