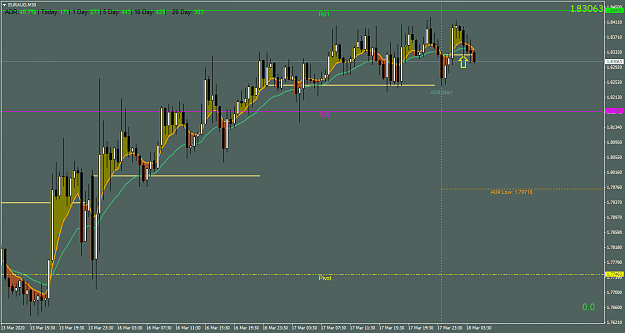
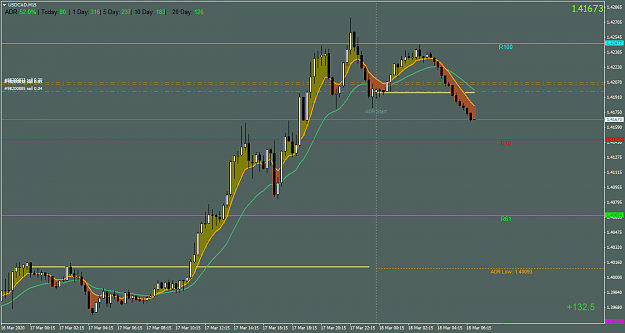
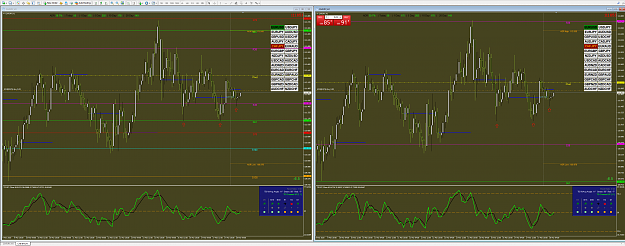
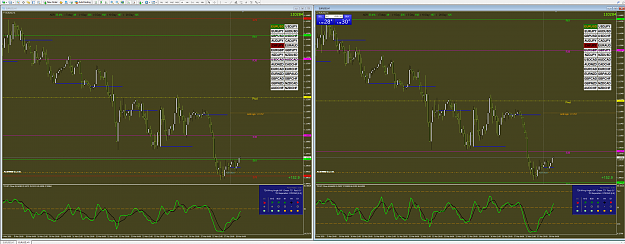
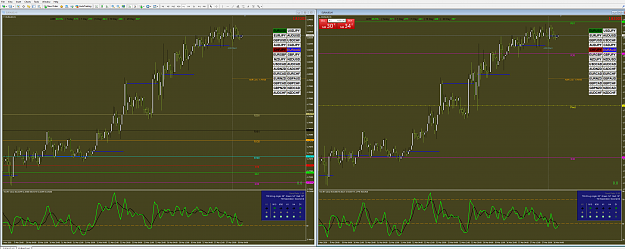
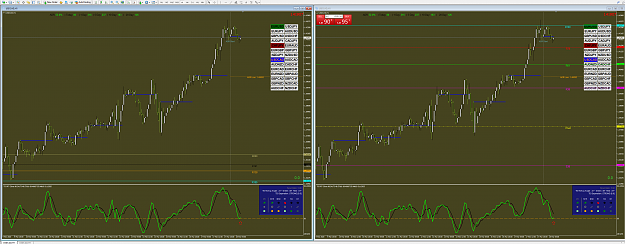
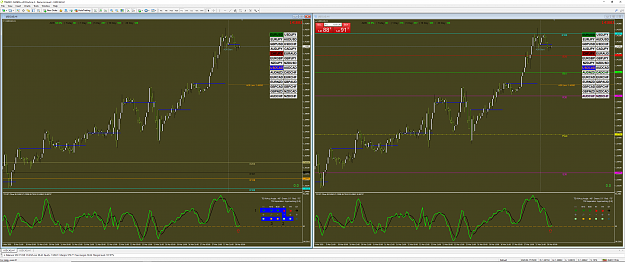
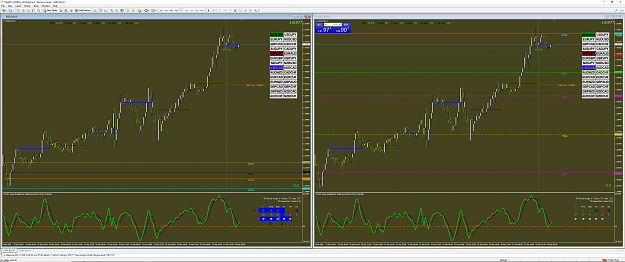
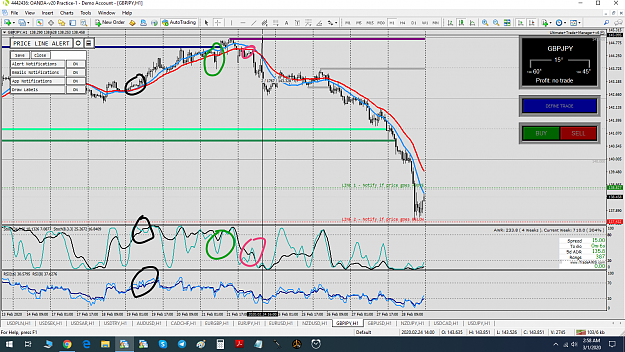
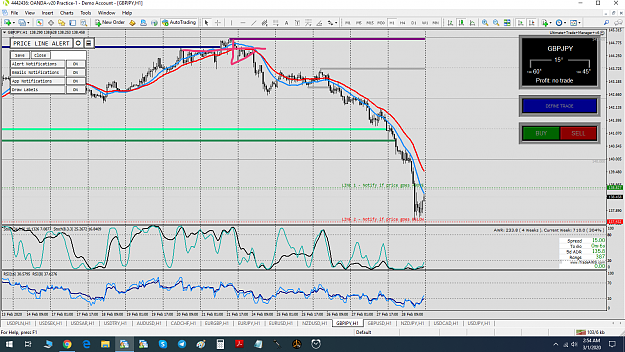
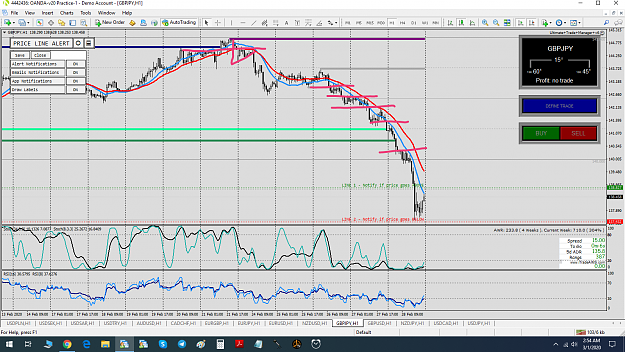
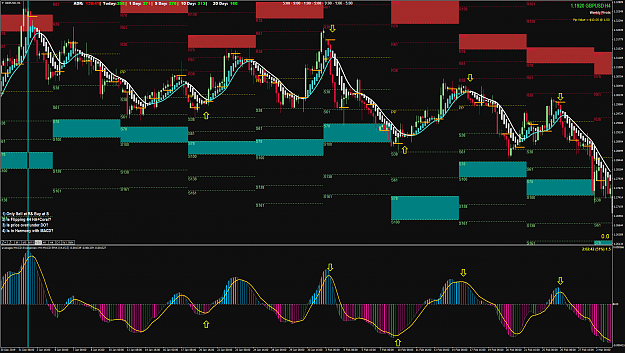
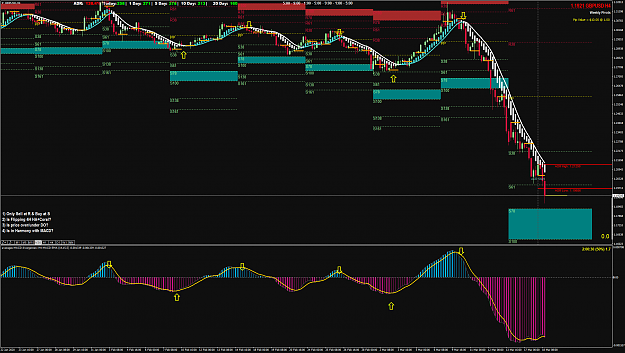
• Home
  • Forums
  • Trades
  • News
  • Calendar
  • Market
  • Brokers
  • Login
  • Join
  • 6:55am
Menu
  • Forums
  • Trades
  • News
  • Calendar
  • Market
  • Brokers
  • Login
  • Join
  • 6:55am
Sister Sites
  • Metals Mine
  • Energy EXCH
  • Crypto Craft

Options

Bookmark Thread

First Page First Unread Last Page Last Post

Print Thread

Similar Threads

Open Trade near Pivot line (Pivot Point) 14 replies

Weekly Pivot to Pivot Trading 19 replies

The Pivot Net Revisited (Weekly Pivot Net) 41 replies

Help with daily pivot, weekly pivot on MT4 3 replies

Pivot high - Pivot low MT4 3 replies

  • Trading Systems
  • /
  • Reply to Thread
  • Subscribe
  • 22,640
Attachments: Pivot Trading
Exit Attachments
Tags: Pivot Trading
Cancel

Pivot Trading

  • Last Post
  •  
  • 1 17721773Page 177417751776 2193
  • 1 Page 1774 2193
  •  
  • Post #35,461
  • Quote
  • Mar 17, 2020 9:28pm Mar 17, 2020 9:28pm
  •  BWilliam
  • Joined Jan 2020 | Status: Member | 2,281 Posts
Quoting Romanov102
Disliked
{quote} Interesting Davit. I post charts on here for years that meet the specification you've put in place from MT4. However the charts I trade from on my Professional Trading Platform appear a lot different. So I'll take the Liberty and spill the beans to post a chart some of its proprietary so you can't get it on MT4 however I can show you a way I figured out to duplicate it as close as you can on MT4. I use an 8 EMA white line 21 EMA Red line 50 EMA Blue 200 SMA Keltner Bands and Bollinger Bands. Also the proprietary signal I use which has the...
Ignored
Can you see price?
Trade the value
 
2
  • Post #35,462
  • Quote
  • Edited 10:28pm Mar 17, 2020 9:59pm | Edited 10:28pm
  •  Davit
  • Joined Feb 2012 | Status: Member | 21,376 Posts
Quoting BWilliam
Disliked
{quote} There are tons of questions to answer when the trader uses MAs. What MA, SMA, EMA, LWMA, TMA... ? What parameter, 3,5,12,21,50,100,200... ? Single MA, dual MA, triple MA, quadruple MA... ? Price cross MA, MA1 Cross MA2... ? What does price re-represented by MA(statistical representation) mean? What's the purpose of re-representing ohlc price with statistical MAs? What governs the choice of the chosen MA, calibration and usage? Basically what additional info MAs give that price doesn't? What additional...
Ignored
Those already answered. "Basically what additional info MAs give that price doesn't?" Its hard visualizing price movement by price alone.MA are tools which are perfect in this aspect. Furthermore gauging the sentiment.
Key institutional MA is 200 and something to be aware when it crosses huge sentiment shift.Its not all answer why my core system is intact MA are just additional tool to make it easier to trade and more profitable.
There is no such a thing as perfect system but I think as it stands this is solid.
In trading, you have to be defensive and aggressive at the same time
 
1
  • Post #35,463
  • Quote
  • Mar 17, 2020 10:00pm Mar 17, 2020 10:00pm
  •  Davit
  • Joined Feb 2012 | Status: Member | 21,376 Posts
EA fits all criteria short.Cleared conservative 30min chart.Rest is just probability.
Attached Image (click to enlarge)
Click to Enlarge

Name: EURAUDM30.png
Size: 52 KB
In trading, you have to be defensive and aggressive at the same time
 
3
  • Post #35,464
  • Quote
  • Mar 17, 2020 10:03pm Mar 17, 2020 10:03pm
  •  Davit
  • Joined Feb 2012 | Status: Member | 21,376 Posts
UC cleared 15min is at zone.
In trading, you have to be defensive and aggressive at the same time
 
 
  • Post #35,465
  • Quote
  • Mar 17, 2020 11:39pm Mar 17, 2020 11:39pm
  •  Romanov102
  • Joined May 2018 | Status: Member | 483 Posts
Quoting BWilliam
Disliked
{quote} Can you see price?
Ignored
Quite clearly dotted gold horizontal bar across the screen and highlighted in red and orange on the right side.
Fib Traders get it right 61.8% to 78.6% of the time. NR
 
 
  • Post #35,466
  • Quote
  • Mar 17, 2020 11:47pm Mar 17, 2020 11:47pm
  •  Davit
  • Joined Feb 2012 | Status: Member | 21,376 Posts
In green on UC
One profitable trade at a time!
Attached Image (click to enlarge)
Click to Enlarge

Name: USDCADM15.png
Size: 47 KB
In trading, you have to be defensive and aggressive at the same time
 
5
  • Post #35,467
  • Quote
  • Edited 12:48am Mar 18, 2020 12:37am | Edited 12:48am
  •  Egbert
  • Joined Aug 2017 | Status: Member | 1,026 Posts
Just to share what I have also noticed,

My first chart is old pivots with price action today.
The second chart is everything this week.
What will be the correct one to trade according to price action?
When price passes R200 strong fundamentals?
The last chart is USDCAD, will the TDI bounce from the 50 line?
VERY INTERESTING
Attached Image(s) (click to enlarge)
Click to Enlarge

Name: CHFJPY.png
Size: 167 KB
Click to Enlarge

Name: EURUSD.png
Size: 160 KB
Click to Enlarge

Name: EURAUD.png
Size: 155 KB
Click to Enlarge

Name: USDCAD.png
Size: 153 KB
Nothing is impossible - IHS
 
3
  • Post #35,468
  • Quote
  • Edited 1:02am Mar 18, 2020 12:50am | Edited 1:02am
  •  Davit
  • Joined Feb 2012 | Status: Member | 21,376 Posts
One thing is certain over stretched pairs will get corrected.Prices tend to gravitate towards equilibrium. Example I dont expect UC stay at 140 its natural place is 130-133 at present economics AU at 66 NU 62-63 EU 112-113 GU 128-130 these are numbers that will get corrected to.
What we are experiencing is unnatural circumstance hence should be looked upon through this lens.
Smart money is going to build positions towards numbers I posted.Keep in mind summer is coming and virus dies at heat.
Just watched a video that it was recommended to blow hot air with drier on your nose area where viruses tend to live and easily die with simple drier.

If you think you have cold do it.Most viruses live on sinus area.
Can't say if this is scientifically proven but better then nothing.Video shows some lab tests but its youtube...
Inserted Video
In trading, you have to be defensive and aggressive at the same time
 
2
  • Post #35,469
  • Quote
  • Edited 1:05am Mar 18, 2020 12:53am | Edited 1:05am
  •  Egbert
  • Joined Aug 2017 | Status: Member | 1,026 Posts
Quoting Davit
Disliked
One thing is certain over stretched pairs will get corrected.Prices tend to gravitate towards equilibrium. Example I dont expect UC stay at 140 its natural place is 130-133 at present economics AU at 66 NU 62-63 EU 112-113 GU 128-130 these are numbers that will get corrected to.
Ignored
I agree,

Can't we then say wait for pivots to catch up with price then?
Down the line the old pivots will catch the future pivots?
According to the basics for the TDI, if price is above the 50 line it's an up trend?

Just my thoughts.
Nothing is impossible - IHS
 
 
  • Post #35,470
  • Quote
  • Mar 18, 2020 1:10am Mar 18, 2020 1:10am
  •  Davit
  • Joined Feb 2012 | Status: Member | 21,376 Posts
Quoting Egbert
Disliked
{quote} I agree, Can't we then say wait for pivots to catch up with price then? Down the line the old pivots will catch the future pivots? According to the basics for the TDI, if price is above the 50 line it's an up trend? Just my thoughts.
Ignored
At present panic situation obviously prices overrun on Pivots.Keep that in mind that at present its hard making sense since fear is driving the markets.Fear is very powerful.I think personally positions should be smaller then normal now.
In trading, you have to be defensive and aggressive at the same time
 
2
  • Post #35,471
  • Quote
  • Mar 18, 2020 1:12am Mar 18, 2020 1:12am
  •  Egbert
  • Joined Aug 2017 | Status: Member | 1,026 Posts
Quoting Davit
Disliked
{quote} At present panic situation obviously prices overrun on Pivots.Keep that in mind that at present its hard making sense since fear is driving the markets.Fear is very powerful.I think personally positions should be smaller then normal now.
Ignored
Could not agree more.

Good luck.
Nothing is impossible - IHS
 
 
  • Post #35,472
  • Quote
  • Mar 18, 2020 2:03am Mar 18, 2020 2:03am
  •  Egbert
  • Joined Aug 2017 | Status: Member | 1,026 Posts
Attached Image (click to enlarge)
Click to Enlarge

Name: USDCAD 4.png
Size: 198 KB
Attached Image (click to enlarge)
Click to Enlarge

Name: USDCAD 5.png
Size: 199 KB
Attached Image (click to enlarge)
Click to Enlarge

Name: USDCAD 6.png
Size: 198 KB
Nothing is impossible - IHS
 
 
  • Post #35,473
  • Quote
  • Edited 2:46am Mar 18, 2020 2:28am | Edited 2:46am
  •  braintheboss
  • Joined Nov 2012 | Status: Coder | 8,520 Posts
Quoting BWilliam
Disliked
{quote} There are tons of questions to answer when the trader uses MAs. What MA, SMA, EMA, LWMA, TMA... ? What parameter, 3,5,12,21,50,100,200... ? Single MA, dual MA, triple MA, quadruple MA... ? Price cross MA, MA1 Cross MA2... ? What does price re-represented by MA(statistical representation) mean? What's the purpose of re-representing ohlc price with statistical MAs? What governs the choice of the chosen MA, calibration and usage? Basically what additional info MAs give that price doesn't? What additional info the trader seek that can't be found...
Ignored
In trading you never can answer a question with only a solution. It's relative market moment and how trader read charts. But taking a simple base ( separation between both MAs ) trader have adapt reading depending price behavior.

For example I use a MA compression approach when happens a breakout and a simple MA cross + price above/below MAs if swing is a big parabolic movement. It's something you learn along the time. I use other MAs setup but at the end important is find one trader feel comfortable. Rules are always same. Only change chart clearness depending how setup shows every market moment

This is an example how I read market. I use MAs + stoch but I use them in a different way as many do it. Basically I use stoch patterns with MA confirmation. And this helps me can anticipate movements and filter a lot of noise

Anyway every trader use his own approach and to use pivots is right as others if trader uses right rules. Finally only important thing is trader feeling
Attached Image(s) (click to enlarge)
Click to Enlarge

Name: 2020-03-01 (2).png
Size: 143 KB
Click to Enlarge

Name: 2020-03-01 (1).png
Size: 128 KB
Click to Enlarge

Name: 2020-03-01.png
Size: 131 KB
Try don't lose pants never...
 
3
  • Post #35,474
  • Quote
  • Edited 3:18am Mar 18, 2020 3:05am | Edited 3:18am
  •  BWilliam
  • Joined Jan 2020 | Status: Member | 2,281 Posts
Quoting braintheboss
Disliked
{quote} In trading you never can answer a question with only a solution. It's relative market moment and how trader read charts. But taking a simple base ( separation between both MAs ) trader have adapt reading depending price behavior. For example I use a MA compression approach when happens a breakout and a simple MA cross + price above/below MAs if swing is a big parabolic movement. It's something you learn along the time. I use other MAs setup but at the end important is find one trader feel comfortable. Rules are always same. Only change chart...
Ignored
MA + oscillator or MA Cross + oscillator are different ways to use MAs.

Bottom line still is what I wrote earlier in post#35465 about the purpose of indicators. Imo those questions have not been explored or discussed in detail after more than 15yrs since the inception of this forum. Members just accept the common practices without question, that's crowd behaviour. This is not the thread to discuss though.
Trade the value
 
 
  • Post #35,475
  • Quote
  • Mar 18, 2020 3:24am Mar 18, 2020 3:24am
  •  bojack34
  • Joined Mar 2017 | Status: Member | 2,043 Posts
Quoting braintheboss
Disliked
{quote} In trading you never can answer a question with only a solution. It's relative market moment and how trader read charts. But taking a simple base ( separation between both MAs ) trader have adapt reading depending price behavior. For example I use a MA compression approach when happens a breakout and a simple MA cross + price above/below MAs if swing is a big parabolic movement. It's something you learn along the time. I use other MAs setup but at the end important is find one trader feel comfortable. Rules are always same. Only change chart...
Ignored
could you please share that AWR indicator? nice and clean and out of the way
 
 
  • Post #35,476
  • Quote
  • Mar 18, 2020 3:26am Mar 18, 2020 3:26am
  •  braintheboss
  • Joined Nov 2012 | Status: Coder | 8,520 Posts
Quoting BWilliam
Disliked
{quote} MA + oscillator or MA Cross + oscillator are different ways to use MAs. Bottom line still is what I wrote earlier in post#35465 about the purpose of indicators. Imo those questions have not been explored or discussed in detail after more than 15yrs since the inception of this forum. Members just accept the common practices without question, that's crowd behaviour. This is not the thread to discuss though.
Ignored
I only told you trading is a subjective art. You cant find an exact answer of any question. And indicators are only other subjective way for get references. Just I used an example for you can see how every trader see a different thing in same chart and tools. Im sure you will do a different reading of that captures

Quoting bojack34
Disliked
{quote} could you please share that AWR indicator? nice and clean and out of the way
Ignored
I think is a tool I shared in my thread but not sure. Ask pipflak. These are his captures. It was a conversation about trading references using my approach
Try don't lose pants never...
 
1
  • Post #35,477
  • Quote
  • Mar 18, 2020 5:40am Mar 18, 2020 5:40am
  •  MrAussieFX
  • Joined Jan 2014 | Status: Member | 635 Posts
AUDCAD 30 minute Sell position

Attached Image (click to enlarge)
Click to Enlarge

Name: AUDCAD 30 MINUTE BAT RETEST AFTER TYPE 1 18 MARCH 2020.png
Size: 254 KB


The first batch of 50 pips hit and then stopped out

Attached Image (click to enlarge)
Click to Enlarge

Name: AUDCAD 30 MINUTE FIRST BATCH TP HIT 18 MARCH 2020.png
Size: 169 KB


Best regards
 
1
  • Post #35,478
  • Quote
  • Mar 18, 2020 6:40am Mar 18, 2020 6:40am
  •  MrAussieFX
  • Joined Jan 2014 | Status: Member | 635 Posts
CADJPY on watchlist

Attached Image (click to enlarge)
Click to Enlarge

Name: CADJPY 1 HOUR BULLISH CRAB 18 MARCH 2020.png
Size: 162 KB


Kindest regards
 
1
  • Post #35,479
  • Quote
  • Mar 18, 2020 6:58am Mar 18, 2020 6:58am
  •  1pipperhour
  • Joined Jun 2010 | Status: Member | 1,487 Posts
Personnaly thinking taking my funds out of my account. Not sure how brokers survive this or what they are doing. Just watching 3-6 months what happens next and how long will it take to come out of this economical crisis which will follow. Lots of to think about ...

Watching EG over a week now and will not be surprised to see this at 1.000 in near future.
 
2
  • Post #35,480
  • Quote
  • Edited 12:04pm Mar 18, 2020 8:07am | Edited 12:04pm
  •  Cryptosurf
  • Joined Feb 2015 | Status: Member | 1,561 Posts
I had been trying to teach my older brother to trade. I set up a simple weekly pivot range based system for him. He remarkably has been doing pretty well. I simply added a smooth HA (minus the wicks) and a Coral trend to show direction change. Also a MACD with a custom setting of 14-15-5 to show the rollover. Also have rules noted to pay attention to.

Edit: Template added

Attached Image (click to enlarge)
Click to Enlarge

Name: GBPUSDH4.png
Size: 163 KB

Attached Image (click to enlarge)
Click to Enlarge

Name: GBPUSDH4_2.png
Size: 116 KB
Attached File(s)
File Type: rar Pivots+Smooth HA.rar   226 KB | 906 downloads
Trade with confidence, trade without fear.
 
19
  • Trading Systems
  • /
  • Pivot Trading
  • Reply to Thread
    • 1 17721773Page 177417751776 2193
    • 1 Page 1774 2193
31 traders viewing now, 3 are members:
Invisible
,
Runlax
,
Gabnsor
  • More
Top of Page
  • Facebook
  • Twitter
About FF
  • Mission
  • Products
  • User Guide
  • Media Kit
  • Blog
  • Contact
FF Products
  • Forums
  • Trades
  • Calendar
  • News
  • Market
  • Brokers
  • Trade Explorer
FF Website
  • Homepage
  • Search
  • Members
  • Report a Bug
Follow FF
  • Facebook
  • Twitter

FF Sister Sites:

  • Metals Mine
  • Energy EXCH
  • Crypto Craft

Forex Factory® is a brand of Fair Economy, Inc.

Terms of Service / ©2023