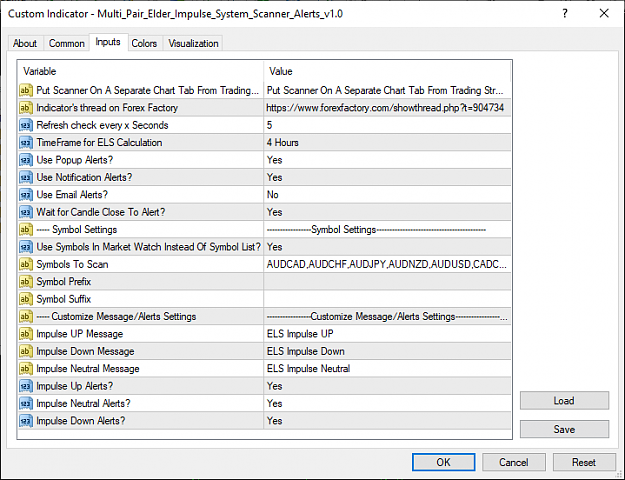
Disliked{quote}you can change the timeframe with setting TimeFrame for HA CALculation = default is H4Ignored
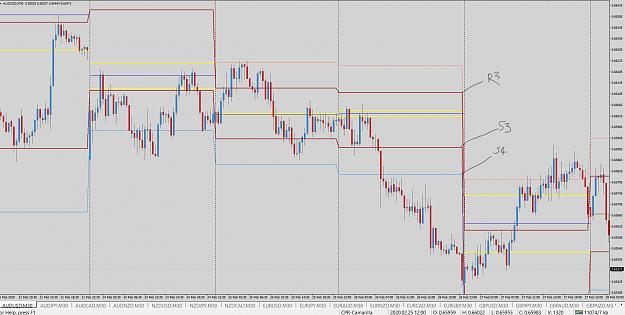
 Multi Pair Pivot Point Scanner Alerts mt4

- #180
- Mar 26, 2020 10:02pm Mar 26, 2020 10:02pm
“The only true wisdom is in knowing you know nothing.”