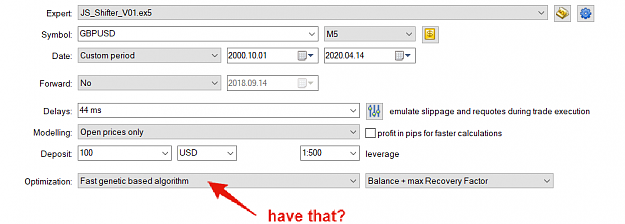
DislikedUsing open prices modeling for that - because then very fast optimizations for considerably long history at least 10 yearsIgnored
DislikedI see that on various brokers there are various results because of slightly different prices...Ignored
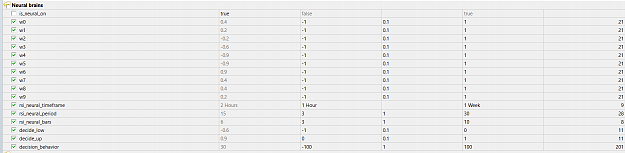
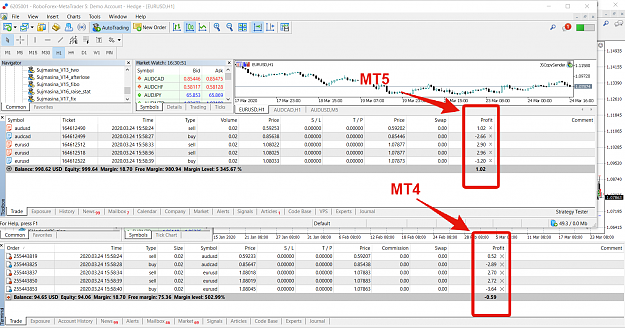
Now it is fixed and the new EA version (with included additional strategies) attached to the post nr. 1
Now Darwinex and Admiral provide similar (but still quite different) results (Darwinex is ECN and use commissions, therefore different results). See Admiral Markets and Darwinex backtests with real ticks (but EA was optimized with open prices just on Admiral Markets data):
Attached File(s)
Attached File(s)
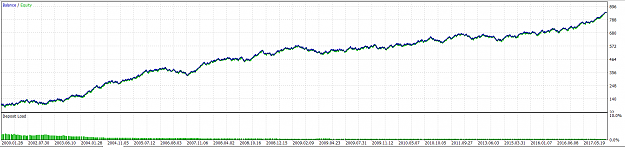
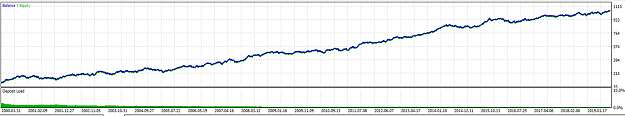
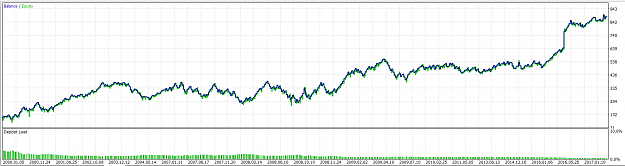
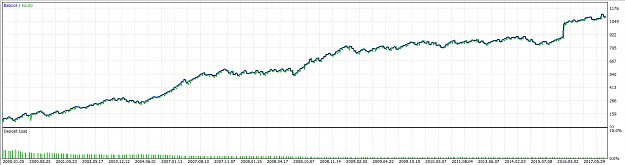
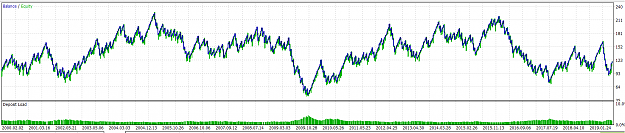
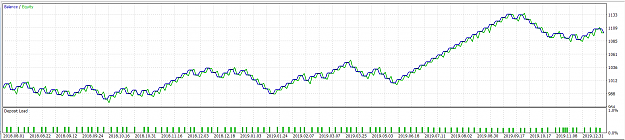
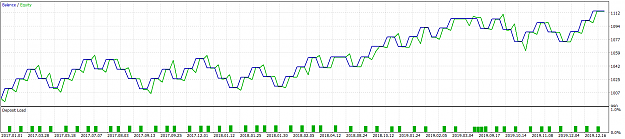
But as you can see similarity now is notable - balance ups and downs is correlating for Admiral vs Darwinex:
Darwinex EURUSD:
Attached Image (click to enlarge)
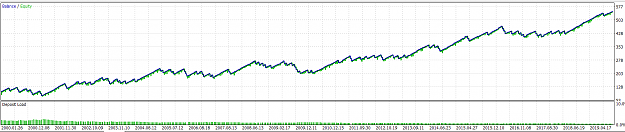
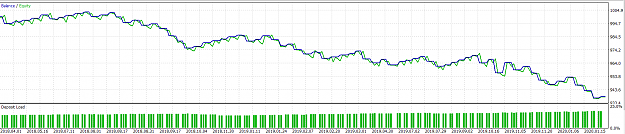
Admiral EURUSD:
Attached Image (click to enlarge)
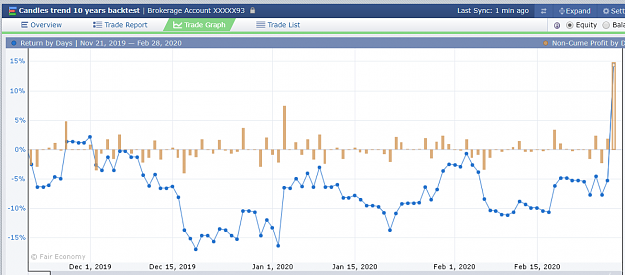
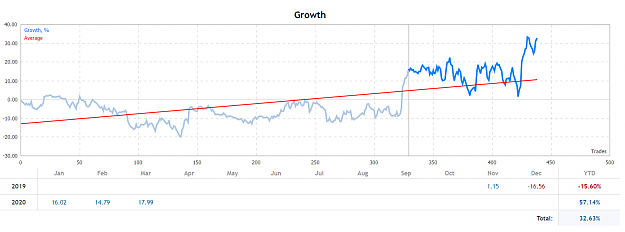
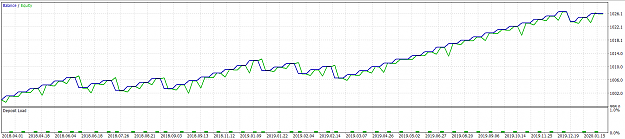
And different story for SP500:
Darwinex SP500:
Attached Image (click to enlarge)
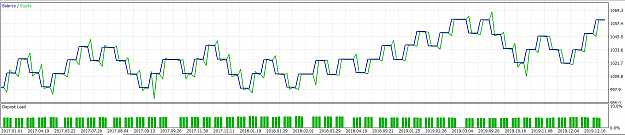
Admiral SP500:
Attached Image (click to enlarge)
As we can see SP500 is not correlating at all...
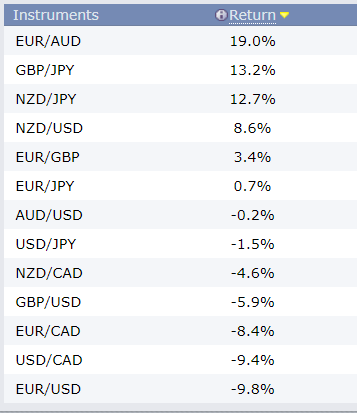
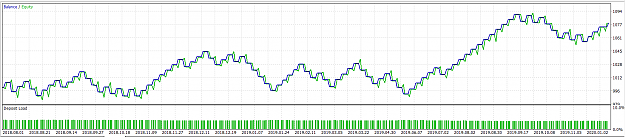
Here GBPUSD - quite corelated:
Darwinex GBPUSD:
Attached Image (click to enlarge)
Admiral GBPUSD:
Attached Image (click to enlarge)
Maybe if a symbol is not "popular" (not "Major"), then it would be hard to find similarities across different brokers?