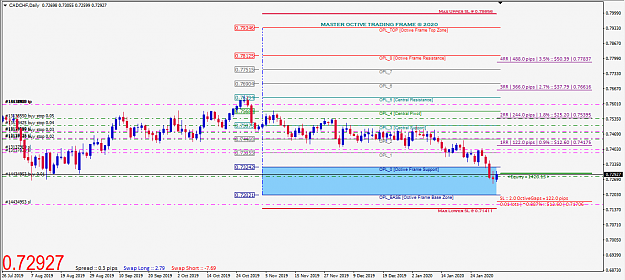
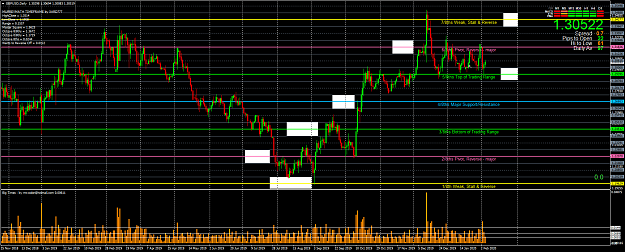
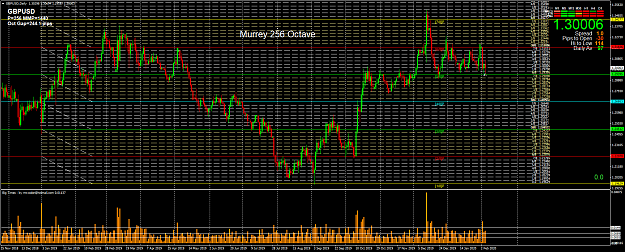
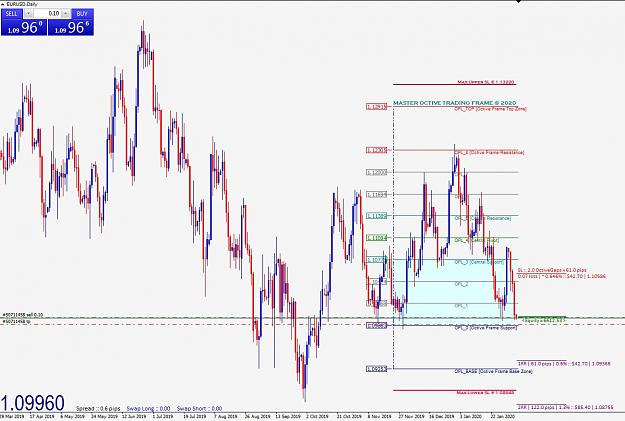
Example mechanical study for USDCHF [W1 TF].
Traders do not need sophisticated indicators and Expert Advisors to perform basic symbol studies across a few pairs.
As the complexity increases then that's a different matter and I have a stable full of ready made tools.
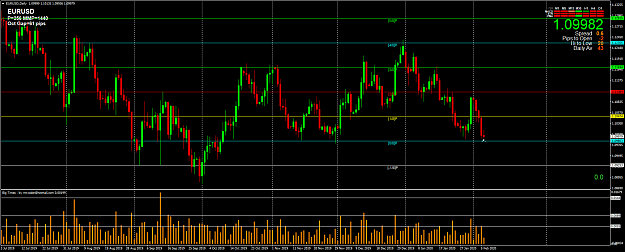
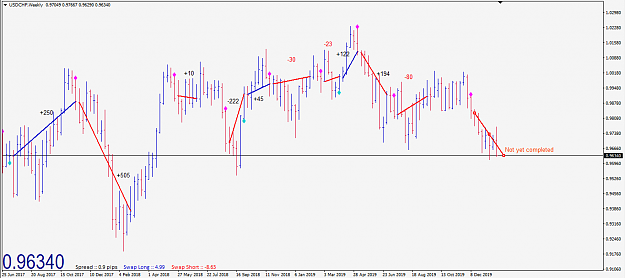
USDCHF [Weekly Chart]
Test Period :: July 16, 2017 to the current week 2.5 years
Swap :: no bias
Quad Direction :: no bias
Octive Gap :: ~ 122 pips (this may vary and an advanced tool to derive the Octive Gap on a specific date makes the task much faster and easier)
SL :: up to a max 2 OGs or 244 pips in this example with stopout occurring if price runs against the entry by more than 244 pips.
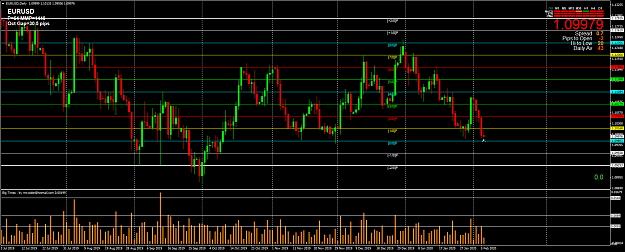
Entry trigger - Quad Weekly Long or Quad Weekly Short completion and entry on the next W1 Bar (Open price).
Trade Management - none applied in this example (raw set & almost forget approach).
Close Trigger - 2 by opposite colored W1 bars.
I have shown on the chart approximate pips for each completed trade using Quad Weekly Long and Quad Weekly Short setups.
Points to consider in additional studies:
1. Trade Duration on W1 TFs;
2. Add in targets of 1RR;
3. How does a bias towards positive swap direction play out;
4. What RR is 'best' for this symbol based on the bars used in the study ?
5. What happens over a 5 year or 7 year or 10 year period of time ?
6. What filters appear to work best and are likely to provide ongoing longer term positive gains ?
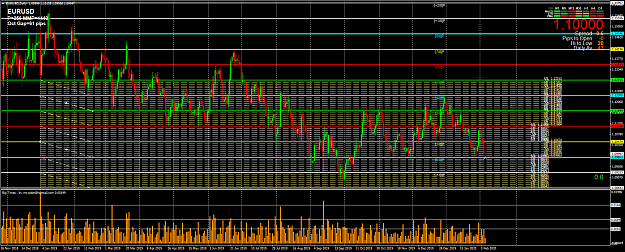
7. Now do studies across the 28 common symbols using D1 and W1 !
This is only the very basic approach to a mechanical type study but if traders do some work in this space they will discover what works best.
The advanced set of tools make life much much easier especially the Expert Advisors and Trade Management EA's but the good news is that traders can still be very profitable applying the basic Quad Patterns on a basic D1 or W1 chart.
Good trading,
Masterrmind...............
Attached Image (click to enlarge)
Traders do not need sophisticated indicators and Expert Advisors to perform basic symbol studies across a few pairs.
As the complexity increases then that's a different matter and I have a stable full of ready made tools.
USDCHF [Weekly Chart]
Test Period :: July 16, 2017 to the current week 2.5 years
Swap :: no bias
Quad Direction :: no bias
Octive Gap :: ~ 122 pips (this may vary and an advanced tool to derive the Octive Gap on a specific date makes the task much faster and easier)
SL :: up to a max 2 OGs or 244 pips in this example with stopout occurring if price runs against the entry by more than 244 pips.
Entry trigger - Quad Weekly Long or Quad Weekly Short completion and entry on the next W1 Bar (Open price).
Trade Management - none applied in this example (raw set & almost forget approach).
Close Trigger - 2 by opposite colored W1 bars.
I have shown on the chart approximate pips for each completed trade using Quad Weekly Long and Quad Weekly Short setups.
Points to consider in additional studies:
1. Trade Duration on W1 TFs;
2. Add in targets of 1RR;
3. How does a bias towards positive swap direction play out;
4. What RR is 'best' for this symbol based on the bars used in the study ?
5. What happens over a 5 year or 7 year or 10 year period of time ?
6. What filters appear to work best and are likely to provide ongoing longer term positive gains ?
7. Now do studies across the 28 common symbols using D1 and W1 !
This is only the very basic approach to a mechanical type study but if traders do some work in this space they will discover what works best.
The advanced set of tools make life much much easier especially the Expert Advisors and Trade Management EA's but the good news is that traders can still be very profitable applying the basic Quad Patterns on a basic D1 or W1 chart.
Good trading,
Masterrmind...............
Master your Mind then Master your Trades