{quote} AUD/USD - Update! Still looking to hold the short positons going into ECM. Moving Risk to 0%. As of now we are running +40 pips in floating netprofit - with no risk. Lets see what happens on ECM, very exciting! {image}
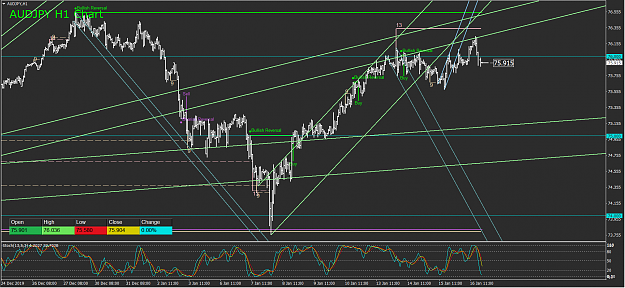
{quote} AUD/JPY Update - Follow Up Price did not exceed the breakout-bars low within 3 time units, instead price generated a 9 exhaustion pattern, warning that we might see a rally to test resistance. I am closing the trade with +18 pips in net profit as we did not get the follow-through as hoped. Result: +18 pips Total NetProfit/Loss in SoS Trading Journal: +39 pips Moving on to the next trade... {image}
Ignored
Quick follow up on the CLOSED AUD/JPY trade.
As expected price rallied up to test resistance.
Risk management was spot on thanks to the golden rule of 3!
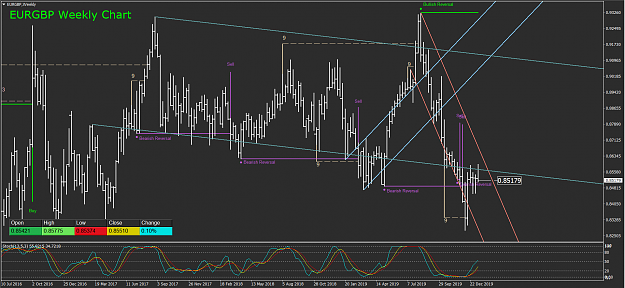
{quote} Btw, I spotted this potential set-up through the Capital Flow Model. {image}
Ignored
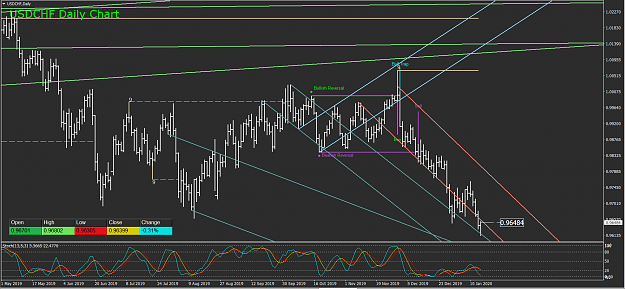
USD/CHF - Removed from Watchlist We did not get a pullback to the level we hoped for a short entry on USD/CHF. Instead as the capital flow indicator signaled, a strong bearish trend, price continued moving lower and have reached the projected target. Scratching this pair from the watchlist.
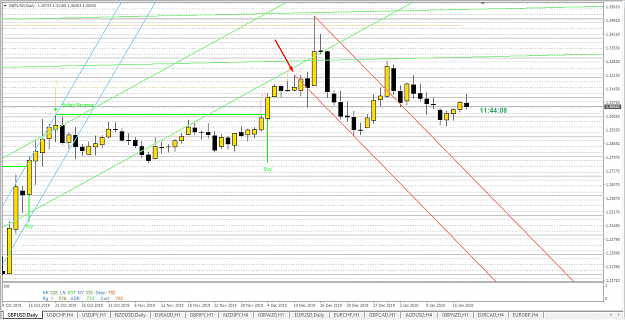
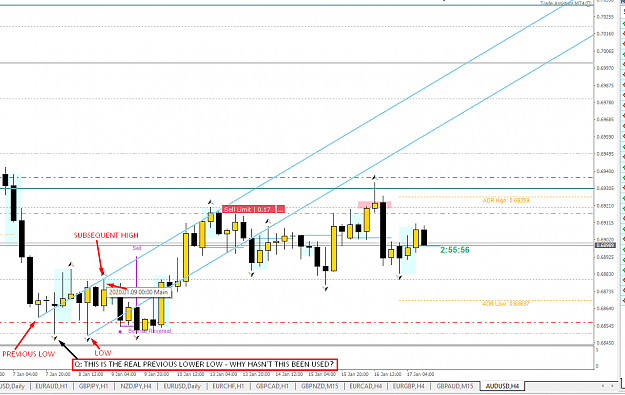
Why is the arrow bar deemed the "previous high"? The black candle next to the shadow high is higher. Also, is there a rule that says a "previous" high or low bar/candle cannot be adjacent to the actual high/low? Hope this makes sense.
I really like the indicators... and the signals... what is the best time frame to trade.. and is there an alter when things change?
I was up on 3 positions on GCFH 75 (it spiked to 120) pips then I woke up and it hit my SL..
I am just trying to form the best trading strategy, I think this has a lot of potential.
{image} My comments are on the chart image. The question is actually about the selection of the "previous low".
Ignored
Answer to both Q´s,
To what you point to as previous high is not a high, its a reaction off a high.
To what you point as previous low is not a low, its also a reaction off a low.
This is why the computer does the analysis, so that OPINION dont get in the way.
You are wasting time trying to figure out this stuff, as you can see it draws the cyles perfectly. Focus on trading them
I really like the indicators... and the signals... what is the best time frame to trade.. and is there an alter when things change? I was up on 3 positions on GCFH 75 (it spiked to 120) pips then I woke up and it hit my SL.. I am just trying to form the best trading strategy, I think this has a lot of potential.
Ignored
Thanks,
Market is fractal, so any time frame.
Use golden rule of 3 time reactions, and try to learn cycles etc. www.armstrongeconomics.com is a great source.
{quote} Answer to both Q´s, To what you point to as previous high is not a high, its a reaction off a high. To what you point as previous low is not a low, its also a reaction off a low. This is why the computer does the analysis, so that OPINION dont get in the way. You are wasting time trying to figure out this stuff, as you can see it draws the cyles perfectly. Focus on trading them
Ignored
I'm not actually trying to "figure it out" per se or "figure it out" for the sake of it. Being naturally analytical, I'm simply trying to validate my understanding of the "break" and "break-out" lines from the Martin Armstrong PDF against what I am seeing on the chart, as generated by the SoS indicator which, at this stage, is the obvious arbiter of truth in this regard. I'm obviously not understanding the creation of these channels as much as I would hope to. Nevertheless, as you rightly infer, whether I understand the channel creation or not, it doesn't stop one from trading the channel(s).
{quote} I'm not actually trying to "figure it out" per se or "figure it out" for the sake of it. Being naturally analytical, I'm simply trying to validate my understanding of the "break" and "break-out" lines from the Martin Armstrong PDF against what I am seeing on the chart, as generated by the SoS indicator which, at this stage, is the obvious arbiter of truth in this regard. I'm obviously not understanding the creation of these channels as much as I would hope to. Nevertheless, as you rightly infer, whether I understand the channel creation...
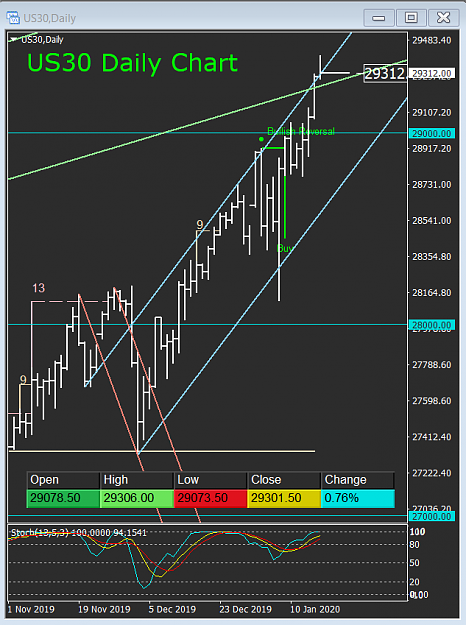
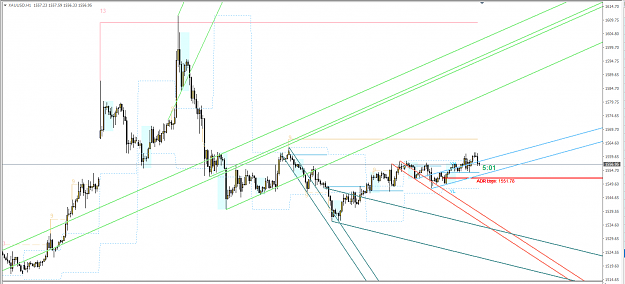
Bull Trap in GOLD moving into ECM as well... Big drop on the 20th? {image}
Ignored
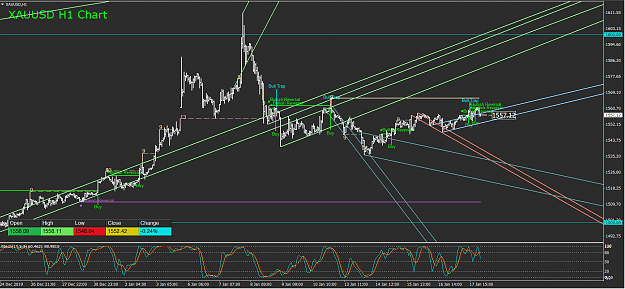
Here's my gold chart. I'm not showing the bull traps/reversals etc around the current price action like your image shows. I'm at V1.25. Just a heads-up really.
{quote} Here's my gold chart. I'm not showing the bull traps/reversals etc around the current price action like your image shows. I'm at V1.25. Just a heads-up really. {image}