{quote} The risk level is the same size of the 9 (or 13) bar, duplicated from (in this case) the low. In other words if the bar that made the 9 is 10 pips then the risk level will be 10pips from the low of the bar. TD RISK LEVEL.
Ignored
Ahhhh, right - understood! This is TD logic. Does this risk factor vary per timeframe? In fact, is it user-defined or is a value specified by Mr Demark?
{quote} Ahhhh, right - understood! This is TD logic. Does this risk factor vary per timeframe? In fact, is it user-defined or is a value specified by Mr Demark?
Ignored
The rules are taken straight from the book, from the TD Risk Management chapter. It's always the range of the bar x2.
{quote} The rules are taken straight from the book, from the TD Risk Management chapter. It's always the range of the bar x2.
Ignored
If you have a 9 on the 1hr chart, and a 9 on the 4hr chart that line up on the same interval then you obviously use the higher time frame risk. Higher time frame always rules.
@Studentof Soc
Thank you for answering my question..I`m going to understand it a bit better.. the timeframe I take my entries is the D1.
So if I got it ok I check the weekly/monthly for risk minimisation..
{quote} Perfect - that makes total sense. Did you reference the book anywhere in this thread? It might be worth a read so I stop asking stupid questions However, thanks for the awesome information. It's slowly clicking into place in my old brain
@Studentof Soc Thank you for answering my question..I`m going to understand it a bit better.. the timeframe I take my entries is the D1. So if I got it ok I check the weekly/monthly for risk minimisation..
Ignored
Yes, well. Always start on the monthly time frame so you know where you are in price... and work your way down. You don't want to be buying in to monthly resistance etc..that's a quick way to go to 0 haha
{quote} Perfect - that makes total sense. Did you reference the book anywhere in this thread? It might be worth a read so I stop asking stupid questions However, thanks for the awesome information. It's slowly clicking into place in my old brain
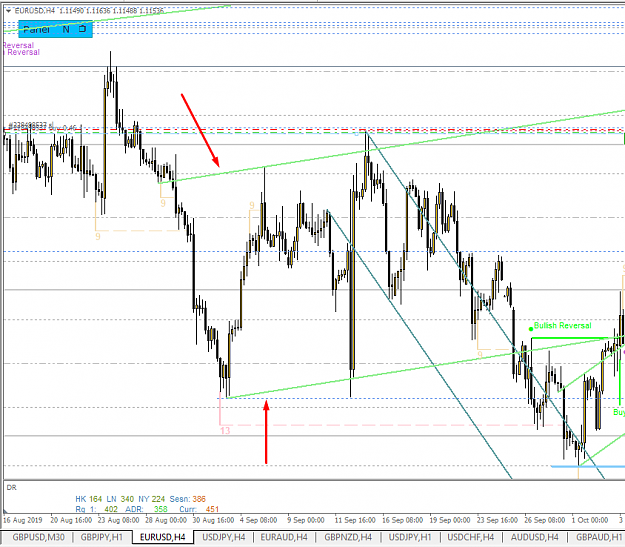
I'm a bit confused on understanding which highs low produced the original line to produce the channel I've arrowed. Are you able to advise? BTW, this is EU/H4 around 30/08/2019. Many thanks.
{image} I'm a bit confused on understanding which highs low produced the original line to produce the channel I've arrowed. Are you able to advise? BTW, this is EU/H4 around 30/08/2019. Many thanks.
Ignored
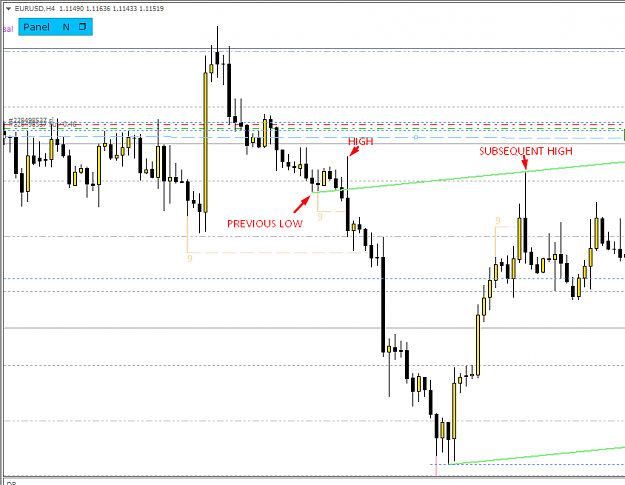
The break line creates the channel, hold the mouse over the lines...you will see a comment appear, main line = break line. Shadow= parallel.
Well yes, but what u marked as "high" is not a high. Why did you mark it? Trying to understand what u actually mean ...
Ahh...ok you are confused now.
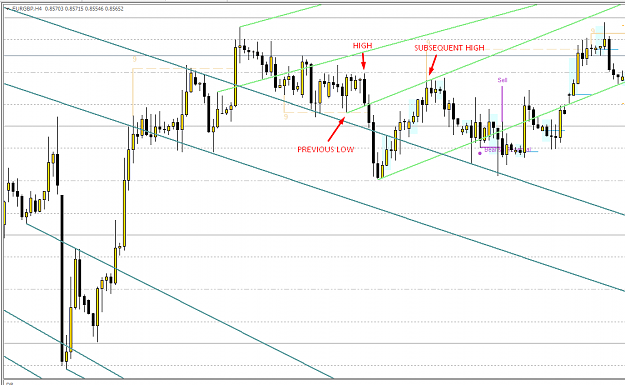
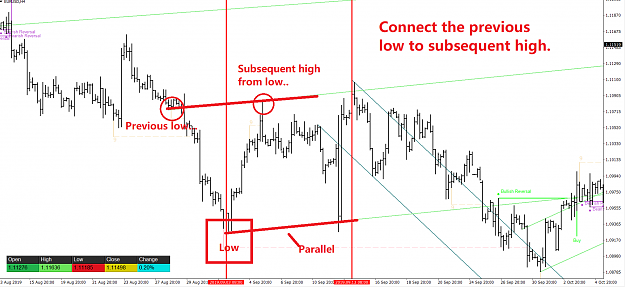
It's just previous low to subsequent high..from the actual low....I am not at computer now so can't show pic, I will later. Check the .PDFs meanwhile you are getting confused with the word "subsequent high".. thinking it should be a high inbetween...hard to explain in word. Will get back to you on this one.
I get it from your sample and the PDFs but, I just can't seem to work it out at the start of the channels in examples like those posted above (and others)?
Just got to this and it's late but initial observation, I think the fact that the previous low wasn't actually a lower low may have been a great source of confusion for me. I'll take a longer look in the morning. Thanks for taking the time to clarify this for me. It's very much appreciated
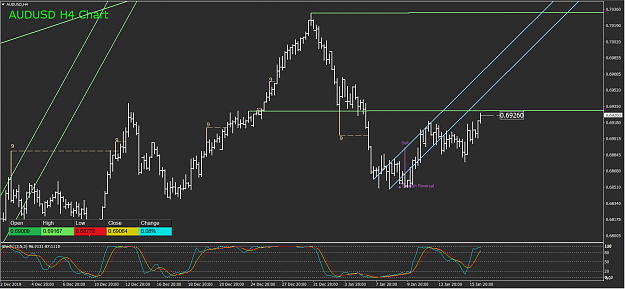
Spotted a potential shorting opportunity on AUD/USD - Long Term? AUD/USD 4hr Chart Anlaysis (One Week ahead of ECM come January 20th) Price has broken and is currently trading below the break line. This is in fact very interesting, because next week is the ECM turning point which may ignite a USD rally and a decline in GOLD (GOLD and AUD have strong correlation). Meaning that a pullback to this level followed by a (9?) reaction to the downside prior to the 20th may actually give us an extremely good entry heading in to the ECM. So stay alerted on...
Ignored
AUD/USD - Update!
About to test resistance...(going short, SL above breakline on a closing basis)
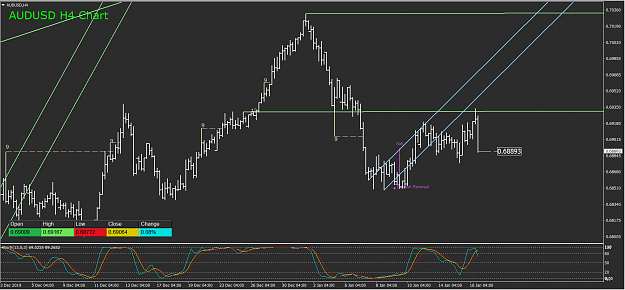
{quote} AUD/USD - Update! About to test resistance...(going short, SL above breakline) {image}
Ignored
AUD/USD - Update!
Still looking to hold the short positons going into ECM.
Moving Risk to 0%. As of now we are running +40 pips in floating netprofit - with no risk.
Lets see what happens on ECM, very exciting!