Orange juice
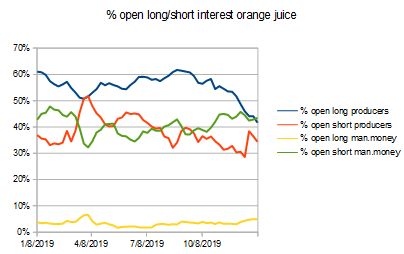
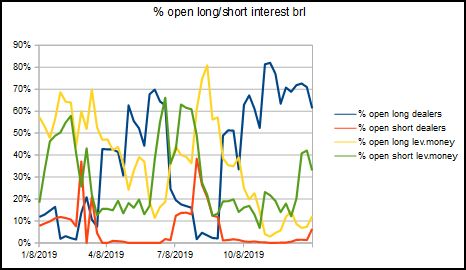
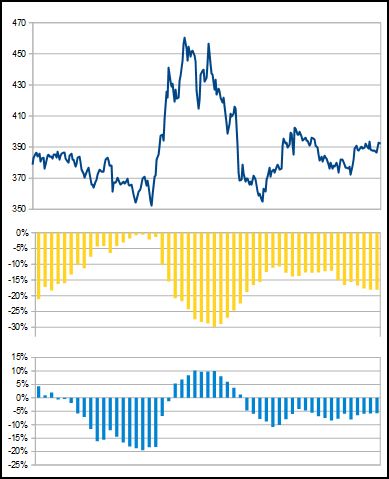
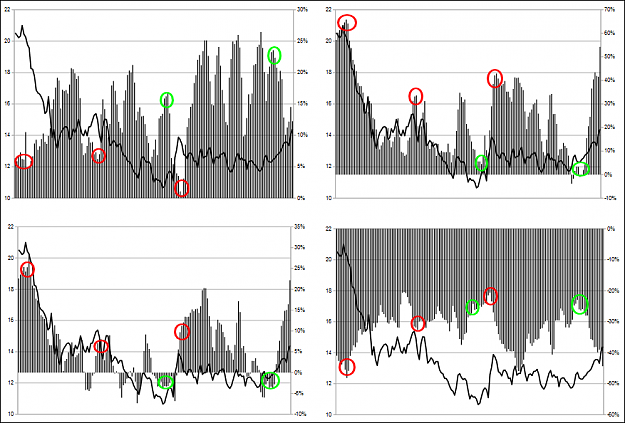
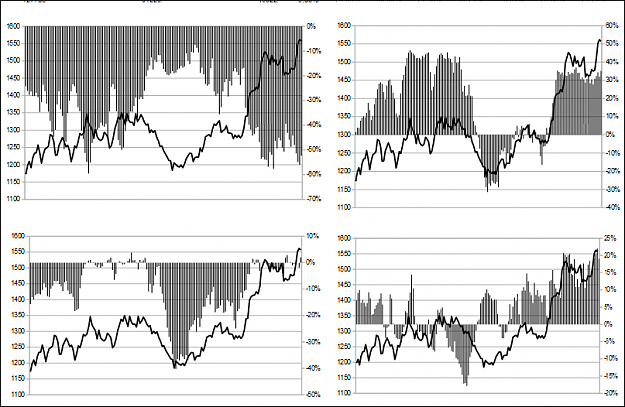
Orange juice analysis for the current week (even though i doubt anyone trades it). This first chart shows the open longs & shorts positions from both producers and money managers (managed funds).
In the producer's view (producers red and blue line), open long have been on steady fall for the past months (from above 60% to near 20%) while open shorts haven't really increased them. So what ? Consumers buyers hedge longs, they are going away for now. Producers are not increasing their short bet, they don't bet on any big fall. Positionning for consumers/users is weak.
In the money manager's view (man.money yellow and green line), open longs are near dead to flat (max 6/7%). Open shorts are above 40% of open interests which is high.
We can expect any fall would bring money managers more shorts, and producers/users will hedge.
Users are not hedging big, they could expect more downside. Money managers are strongly bearish, a bounce could be expected before a new season of downside.
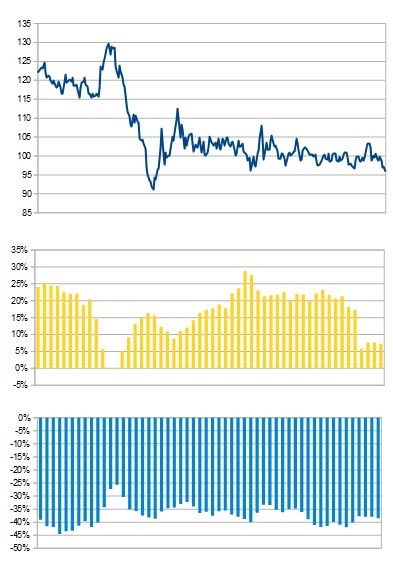
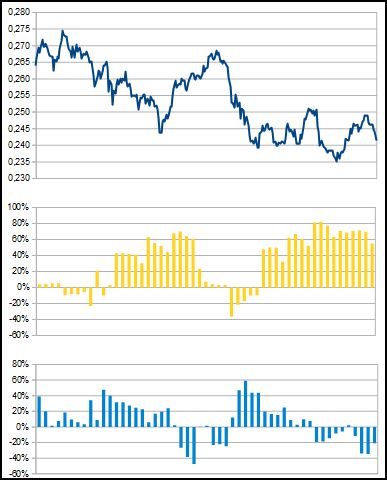
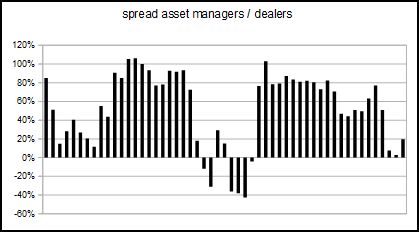
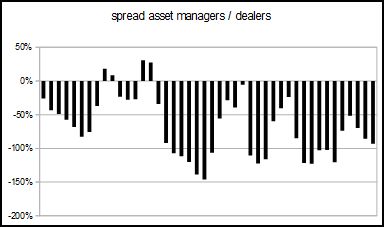
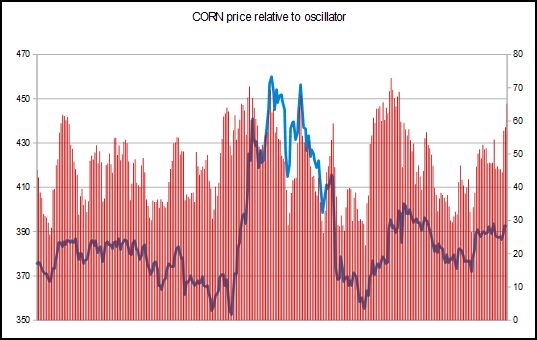
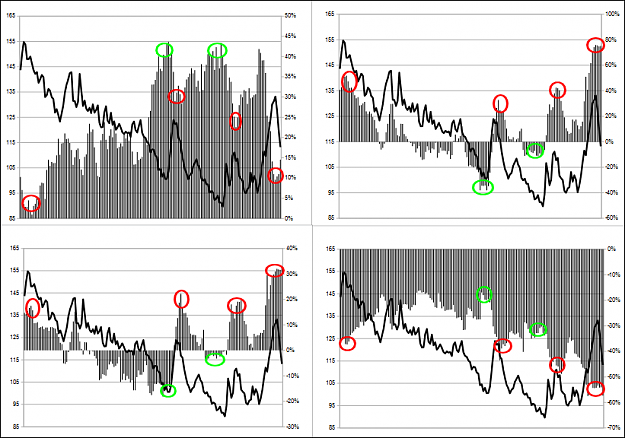
This second chart shows the spread between longs & shorts money managers, and spread between longs & shorts producers.
Both are very important, producers are top/bottom finders, while money managers are trend followers and very wrong at top/bottom.
At the present day, producers are around 5%, such a weak hedge for prices that low, are they expecting more downside?
Money managers have been very short for the the past year, everytime we hit near/below -40% we saw a bounce before selling pressure (from producers) renewed.

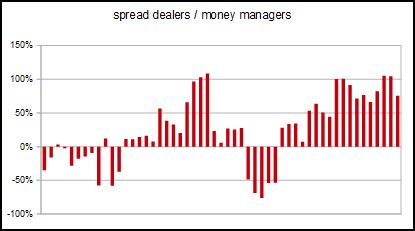
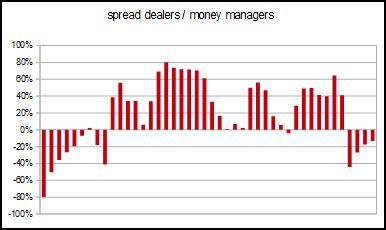
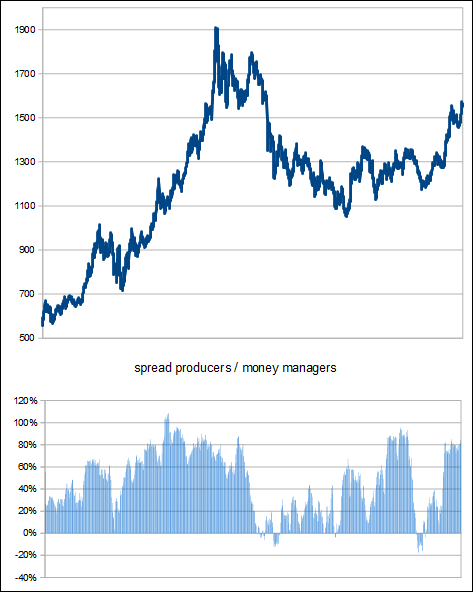
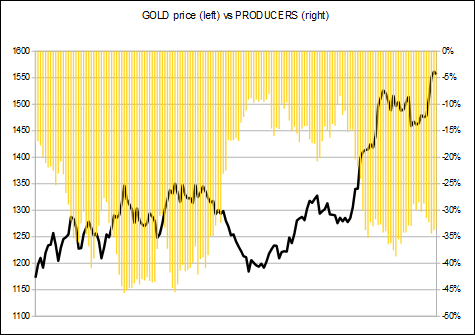
This next chart show the spread between the positions of the producers versus the money managers.
Spread has been positive for the past year meaning operators (producers) have been eyeing a rise
At this level, operators could expect a bounce before more selling appear. Its a tricky area
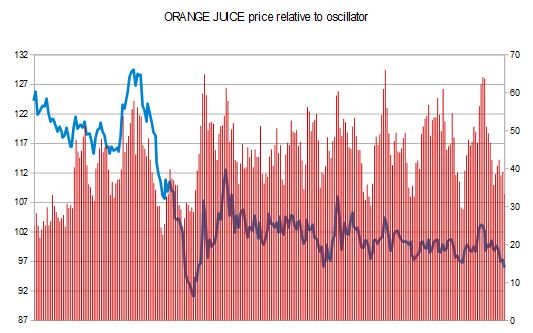
As prices are falling, indicator is not going the same way, its holding strong near 40%, with prices lower than a few weeks ago with indicator higher (and holding).
Shall we see the bounce confirmed by the smart money?
Attached Image
Orange juice analysis for the current week (even though i doubt anyone trades it). This first chart shows the open longs & shorts positions from both producers and money managers (managed funds).
In the producer's view (producers red and blue line), open long have been on steady fall for the past months (from above 60% to near 20%) while open shorts haven't really increased them. So what ? Consumers buyers hedge longs, they are going away for now. Producers are not increasing their short bet, they don't bet on any big fall. Positionning for consumers/users is weak.
In the money manager's view (man.money yellow and green line), open longs are near dead to flat (max 6/7%). Open shorts are above 40% of open interests which is high.
We can expect any fall would bring money managers more shorts, and producers/users will hedge.
Users are not hedging big, they could expect more downside. Money managers are strongly bearish, a bounce could be expected before a new season of downside.
Attached Image
This second chart shows the spread between longs & shorts money managers, and spread between longs & shorts producers.
Both are very important, producers are top/bottom finders, while money managers are trend followers and very wrong at top/bottom.
At the present day, producers are around 5%, such a weak hedge for prices that low, are they expecting more downside?
Money managers have been very short for the the past year, everytime we hit near/below -40% we saw a bounce before selling pressure (from producers) renewed.
Attached Image
This next chart show the spread between the positions of the producers versus the money managers.
Spread has been positive for the past year meaning operators (producers) have been eyeing a rise
At this level, operators could expect a bounce before more selling appear. Its a tricky area
Attached Image
As prices are falling, indicator is not going the same way, its holding strong near 40%, with prices lower than a few weeks ago with indicator higher (and holding).
Shall we see the bounce confirmed by the smart money?
COT: The precious data ignored