@hanover
___
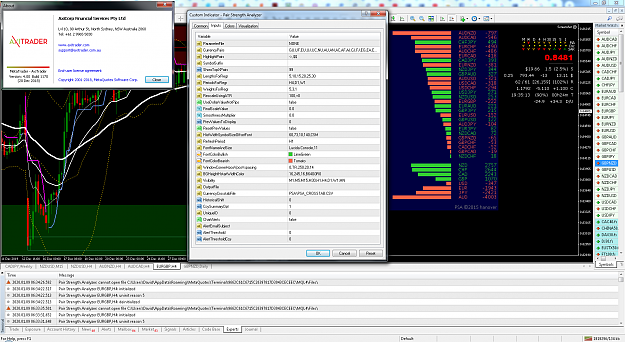
I have this error message showing in the expert tab.
Not sure when it started, but wasn't there when i had just started using the indicator.
Anything to correct?
___
Edit1 _ I have downloaded and started using the latest version (on page1). Will see if the issue persists.
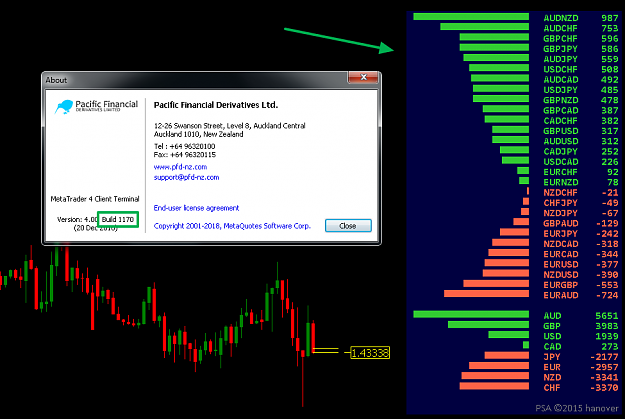
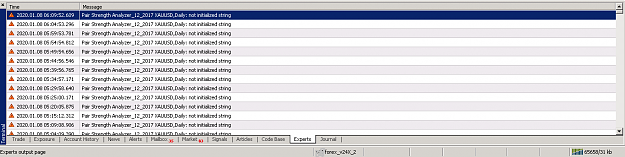
Edit2 _ As per image2, the error persists.
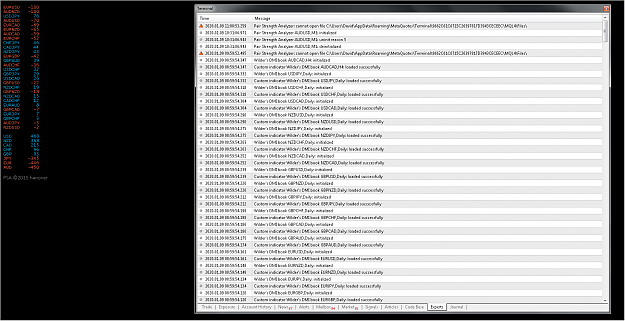
Edit3 _ As per image3, only PSA indicator is used on the chart.
I have this error message showing in the expert tab. Not sure when it started, but wasn't there when i had just started using the indicator. Anything to correct?
Ignored
Thanks for the heads-up.
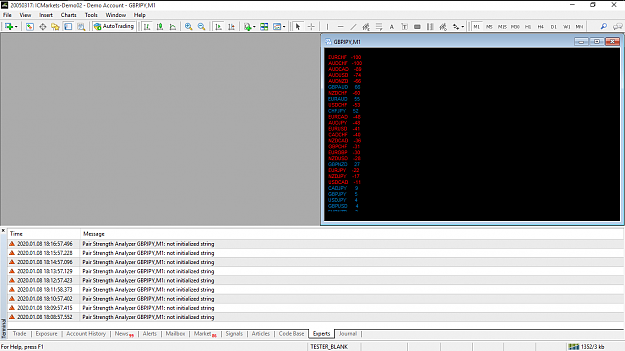
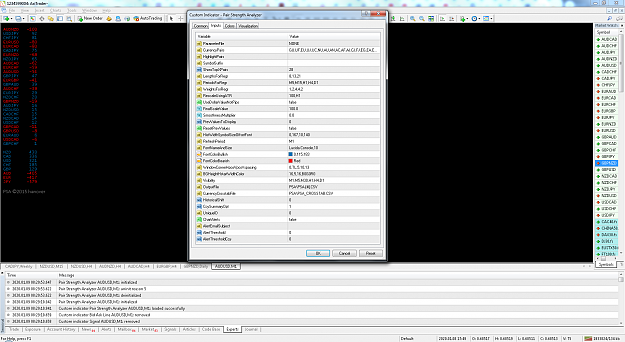
I'm using the attached version of the indicator (should be the same as the one attached to post #1); and also the MT4 version, and the parameters, shown in the screenshot below. I can't reproduce the error you're getting (I get a different error!! — see my screenshot). These errors are posted by MT4, not the indicator, and I can't dig into MT4's source code to get more info. Because it doesn't say which string is not being initialized, it's difficult for me to troubleshoot further.
However, I doubt that the error is affecting the indicator's calculations. You could look at the relevant charts (instrument, time period) on your MT4 and confirm whether the instruments at the top of PSA's list are the most steeply trending upward or downward. If the log files in your ..../MQL4/Logs folder are growing too large, causing a disk space problem, it's safe to delete the oldest ones.
There are many other strength indicators available: see the green typeface in this post.
I have this error message showing in the expert tab. Not sure when it started, but wasn't there when i had just started using the indicator. Anything to correct?
Ignored
Further to my previous post, I just attempted to run with your template, and still couldn't reproduce the error (see screenshot below). You could try using the .ex4 that I posted previously. So if we are both using the same version of the indicator and template, the cause of the error logically lies elsewhere, perhaps you're running a different version of MT4? In which case I can't troubleshoot further.
{quote} Further to my previous post, I just attempted to run with your template, and still couldn't reproduce the error (see screenshot below).......
Ignored
___
Thank you @hanover for your response.
I notice you loaded the Indicator at 10 sec and took the screen shot at 53 sec. That's before the M1 set refresh period. Could you please confirm that even after a minute or two, there wasn't the error msg.
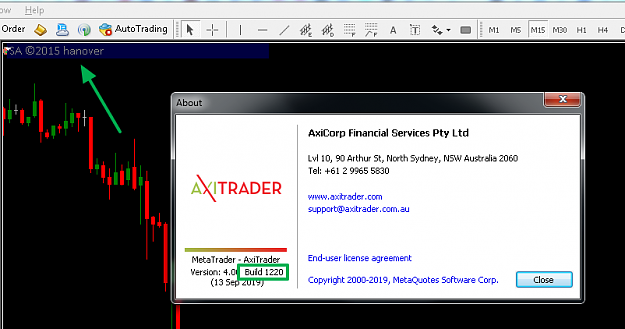
Yes, the error seems not to affect the indicator calculation so far. I'm using MT4 build 1220 I appreciate the links (above) to the other strength indicators, however, i already have PSA in-codded into an Algo running since years back and i am already in love.
Could you please confirm that even after a minute or two, there wasn't the error msg.
Ignored
Below is a screenshot taken just now (the references to Wilder's DMI book refer to an indicator loaded on another chart).
[EDIT] I'm not 100% sure what is causing the "PSA: cannot open file" error, but I suspect it might be because I have two instances of PSA with non-unique file names in the OutputFile and CurrencyCrosstabFile settings, and both instances are trying to write to the same file simultaneously.
Glad you like the indicator. My apologies, I should have recalled the discussions we had earlier in the thread, but my ageing memory is not as good as it once was.
{quote} Below is a screenshot taken just now (the references to Wilder's DMI book refer to an indicator loaded on another chart). [EDIT] I'm not 100% sure what is causing the "PSA: cannot open file" error, but I suspect it might be because I have two instances of PSA with non-unique file names in the OutputFile and CurrencyCrosstabFile settings, and both instances are trying to write to the same file simultaneously. Glad you like the indicator. My apologies, I should have recalled the discussions we had earlier in the thread, but my ageing memory...
Ignored
THANK U SIR
can u please explain to me how to use the indicator? i mean those figures 423, even in thousands why? at what figures do we trade and not.
can u please explain to me how to use the indicator? i mean those figures 423, even in thousands why? at what figures do we trade and not.
Ignored
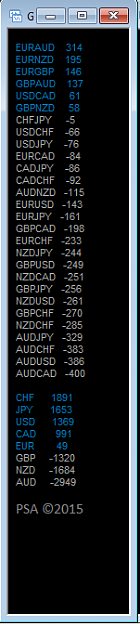
PSA sorts and prints the relative steepness of each pair's price plot, and then summarizes them by currency. Each printed value has no absolute significance in itself; the values are based on regression line slopes calculated from the settings that you provide. This calculation is further explained in post #1, the instruction PDF attached to post #1, and also in post #247.
As to when you should trade, it depends on your personal strategy. PSA provides strength/weakness analysis, not entry or exit signals. Your strategy might be to trade the strongest trends (pairs with the highest positive or negative value), or it might be mean reversion under range bound conditions (PSA value closest to zero). But all of this depends on your goals, timeframes, etc that should be reflected in your settings. PSA is a tool, not a trading system.
More info on strength meters here fwiw.
{quote} PSA sorts and prints the relative steepness of each pair's price plot, and then summarizes them by currency. Each printed value has no absolute significance in itself; the values are based on regression line slopes calculated from the settings that you provide. This calculation is further explained in post #1, the instruction PDF attached to post #1, and also in post #247. As to when you should trade, it depends on your personal strategy. PSA provides strength/weakness...
Ignored
THANK YOU SIR for fast replies i will practice on how it works and get use to it
Can you please provide mql file Pair Strength Analyser (PSA) indicator..??
Ignored
If I did that, anybody could remove the copyright mark, rebadge the indicator, and then sell it (see this). Call me a conspiracy theorist, but whenever somebody asks for mq4 source code without an explanation, I ask myself why they would want it. This whole industry is rife with scams and fraud. I assume you're not a programmer because you've asked for coding help in some of your prior posts.
PSA is written using MQL4 build 509, so you'd need the build 509 compiler if you wanted to modify it yourself. The code is quite complex, there is a lot of functionality built into the indicator; I value my IP (there's a FF member who has used the PSA's output to build a profitable EA) and the time and effort that went into its creation.
If you want to change the default parameter settings, either use a MT4 template, or the parameter file option that's built into the indicator (explained in the instruction PDF).
As shown, the strengths are arranged from <the most bullish to the least bullish>, and <the least bearish to to most bearish> ....
Attached Image (click to enlarge)
BUT i need it to be on a scale of 100.
Such that vertically, it displays +100 to 0 and 0 to -100.
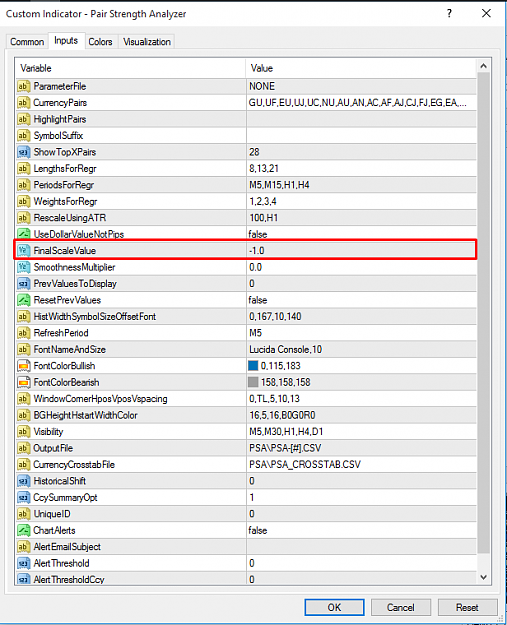
What setting do i need to use at for FinalScaleValue?
As shown, the strengths are arranged from <the most bullish to the least bullish>, and <the least bearish to to most bearish> .... BUT i need it to be on a scale of 100. Such that vertically, it displays +100 to 0 and 0 to -100. What setting do i need to use at for FinalScaleValue?
Ignored
Up until now this wasn't possible.
I have just made a small enhancement; here is how FinalScaleValue works now:
If its value is 0 or 1, the calculated values are displayed as is, without any scaling.
If its value is >1, then the calculated values are scaled to fit the value you input. For example, if you input 1000, then the highest (absolute) value is scaled up or down to +/- 1000, and all other values are scaled by the same factor.
The sign of the value you input (+ or –) determines the way the displayed data is sorted:
If this value is positive, the data is sorted so that the highest positive/negative data (strongest uptrend/downtrend) displays at the top of the list, and the values taper down toward 0 (price is moving sideways) at the bottom of the list.
If this value is negative, the data is sorted so that the highest positive data (strongest uptrend) displays at the top of the list, and the highest negative data (strongest downtrend) at the bottom of the list.
This applies only to the pairs display. The currencies will always display from the highest positive data (strongest currency) at the top of the list, to the highest negative data (weakest currency) at the bottom of the list.
A little experimentation should make everything clear.
I've uploaded the latest version of the .ex4 to post #1.
Anybody wanting the .mq4 file, please see post #370.
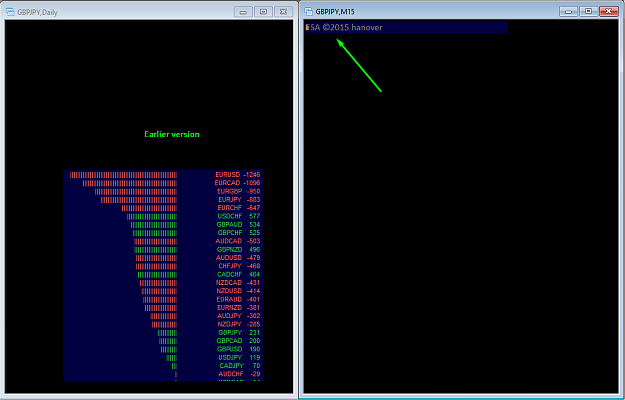
Currently not sure whether the problem is on my side, when i load the new version (with default values), it shows as seen in the image on the right.
No matter what i in put as settings, it keeps like that.
One on the left is the defaults for the earlier version.
Currently not sure whether the problem is on my side, when i load the new version (with default values), it shows as seen in the image on the right. No matter what i in put as settings, it keeps like that. One on the left is the defaults for the earlier version.
Ignored
I think it's being caused by a bug in build 1220 of MT4. The same (new) version of PSA with the same settings is being run in both of the screenshots below. This is really frustrating. I will see if I can find an alternative way of coding it.
I think it's being caused by a bug in build 1220 of MT4. The same (new) version of PSA with the same settings is being run in both of the screenshots below. This is really frustrating. I will see if I can find an alternative way of coding it when I get some spare time. {image} {image}
Ignored
Strange bug, but I think I've fixed it. Same code and settings was definitely working differently in MT4 builds 1170 and 1220.
Try the latest uploaded version in post #1, and please confirm that it's working correctly now, exactly as described in post #372.
I have enhanced PSA so that it is now possible to have it plot the regression lines that caused the values to be calculated, allowing you to view the slopes and weights of these lines. You can switch the lines on and off.
See the 'Modifications History' in post #1 for more details. You can download the latest version from post #1.
I'm glad you like the indicator.
____________________________
@anybody_who's_interested:
I've added three appendices to the 'Pair Stength Analyzer.pdf' instruction manual. This puts all of the info in the 'Modifications History', and the info that was scattered throughout the thread in linked posts, all together in one place. Download it from post #1.