• Home
  • Forums
  • Trades
  • News
  • Calendar
  • Market
  • Brokers
  • Login
  • Join
  • User/Email: Password:
  • 11:49pm
Menu
  • Forums
  • Trades
  • News
  • Calendar
  • Market
  • Brokers
  • Login
  • Join
  • 11:49pm
Sister Sites
  • Metals Mine
  • Energy EXCH
  • Crypto Craft

Options

Bookmark Thread

First Page First Unread Last Page Last Post

Print Thread

Similar Threads

SOS here! Super strange "Stepma" indicator 3 replies

Another new student 6 replies

Forex Without a Job (College/Uni Student) 35 replies

GusForex - College student on a mission 2 replies

student needs answers to some questions 5 replies

  • Commercial Content
  • /
  • Reply to Thread
  • Subscribe
  • 84
Attachments: Student of Socrates (SoS)
Exit Attachments
Tags: Student of Socrates (SoS)
Cancel

Student of Socrates (SoS)

  • Last Post
  •  
  • Page 1 23456 10
  • Page 1 234 10
  •  
  • Post #1
  • Quote
  • First Post: Edited Mar 11, 2020 4:26pm Jan 9, 2020 11:33am | Edited Mar 11, 2020 4:26pm
  •  StudentofSoc
  • | Commercial Member | Joined Jan 2020 | 147 Posts
Hi everyone,
I am a big fan of Martin Armstrongs legendary computer model Socrates (Ai), so I had my own version made; Student of Socrates (SoS)
SoS is not nearly as good as Socrates, however its pretty damn good for technical anlaysis if you ask me.
Quick note: Its more of a guide than an indicator.

(info)
Student of Socrates (SoS)

Student of Socrates applies an untraditional type of technical analysis to your charts which is based up on cyclical analysis and is designed to capture the angle of the market as well as potential price reversals.

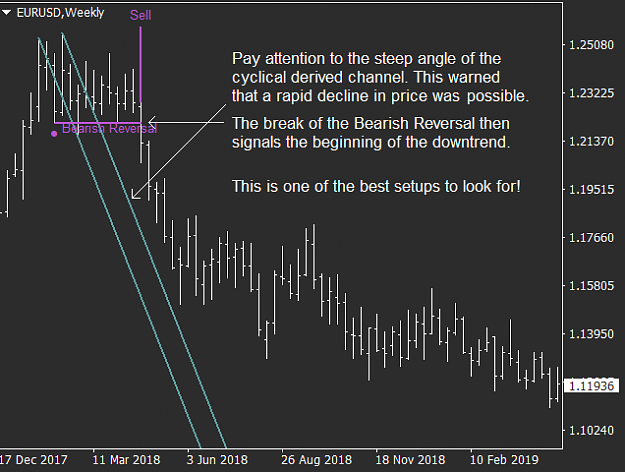
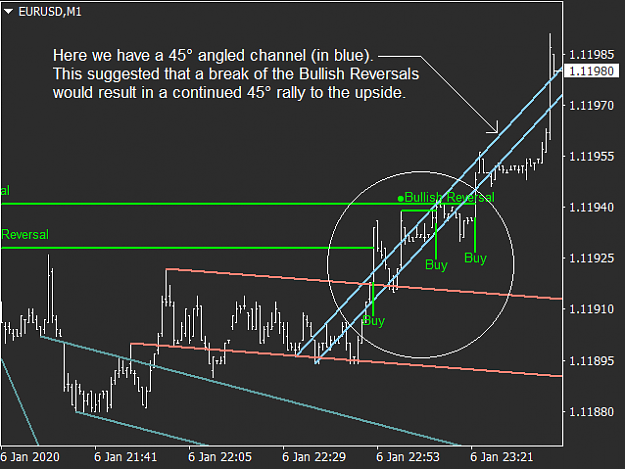
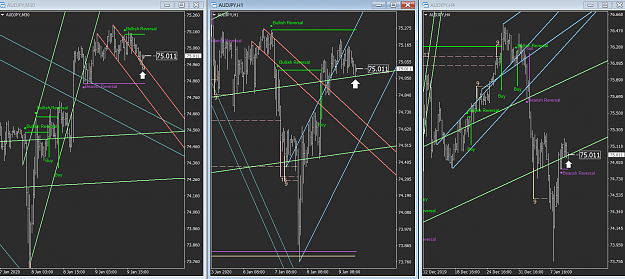
  1. The angle of the cyclically derived channel gives you a roadmap into the future as to what type of move you can expect;
  2. The steeper the angle the greater the tendency for a market to rally/decline rapidly.
  3. The Reversals tells you when a market can break to the up or downside.

Signals

  1. Buy/Sell signals are formed when price breaks through a bullish/bearish reversal on a closing basis.
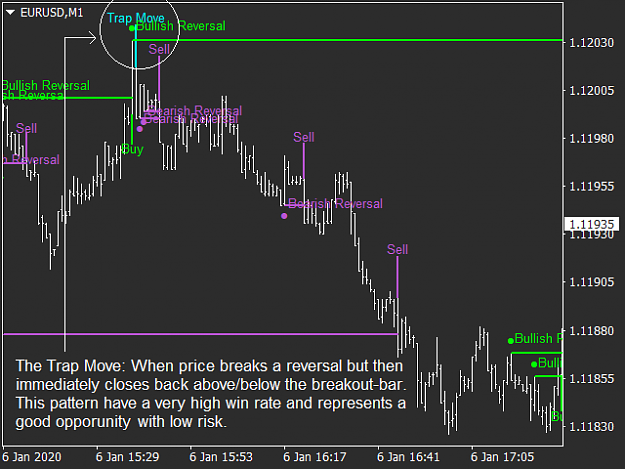
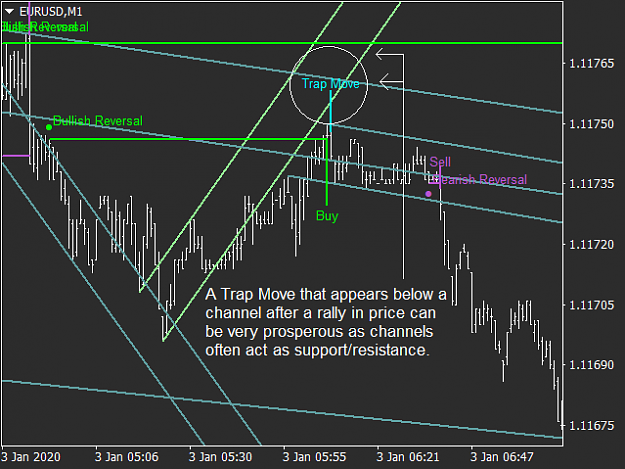
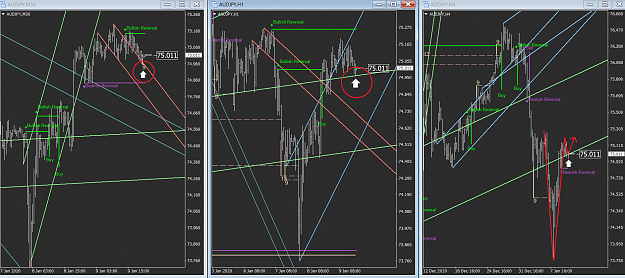
  2. Trap Moves are formed when price breaks a reversal but then immediately closes back above/below the breakout-bar.


Important Reversal Note

  1. Most reversal are displayed in advanced, however some (very few) are displayed after the fact that they occurred or as some might say "late". The "late" reversals are formed when a reversal is created inside of a cycle, which causes a delay. Despite the fact of being delayed; these reversals still highlight important events and is not to be rendered from the charts.


Parameters

  1. Short Term Cycles: 1
  2. Long Term Cycles: 25
  3. Buy/Sell Signal: (Reversal): True/False
  4. Trap Move: True/False
  5. Comment Font Size: 8
  6. Bullish Reversal: Lime
  7. Bearish Reversal: MediumOrchid
  8. Buy Signal: Lime
  9. Sell Signal: MediumOrchid
  10. Trap Move: Aqua
  11. Show Exhaustion Pattern (9/13): True/False
  12. Extend Risk Level: True/False
  13. Show 9 Setup: True/False
  14. Show 13 Countdown: True/False
  15. Color for Buy Price Flip: Wheat
  16. Color for Sell Price Flip: Wheat
  17. Color for Buy Countdown: Pink
  18. Color for Sell Countdown: Pink
  19. Show Previous Day O/H/L/C/C Panel


Latest Version: 1.25 (2020-01-13)
Attachment 3527886

Attached Image(s) (click to enlarge)
Click to Enlarge

Name: Screenshot2.png
Size: 35 KB
Click to Enlarge

Name: Screenshot3.png
Size: 35 KB
Click to Enlarge

Name: Screenshot4.png
Size: 39 KB
Click to Enlarge

Name: Screenshot5.png
Size: 40 KB
  • Post #2
  • Quote
  • Jan 9, 2020 2:47pm Jan 9, 2020 2:47pm
  •  matthew89
  • | Joined Jun 2018 | Status: Member | 235 Posts
OK, this looks very interesting. Thanks for sharing Student of Soc.
A fool learns from his mistakes. A wise man learns from the fools mistakes.
 
1
  • Post #3
  • Quote
  • Edited 7:43pm Jan 9, 2020 3:02pm | Edited 7:43pm
  •  StudentofSoc
  • | Commercial Member | Joined Jan 2020 | 147 Posts
Ok, posting the first trade, one of many more to come!

AUD/JPY Short Term Analysis
Starting from the right on the 4hr chart price closed back inside the channel, creating what looks like a bullish V Shape.
The middle chart, 1hr, is showing a bounce off cyclical support indicating a likely advance to the upside.
Going down one more time frame, arriving at the 30 min chart (to the left) there is a bullish 9 price flip which seems to be buncing off current support as well.

I am going long with a Stop loss @ 74.9546 which is the risk level associated with the 9 price flip setup on a closing basis.
First target is the Bullish Reversal of 75.143.
Attached Image(s) (click to enlarge)
Click to Enlarge

Name: Screenshot4.png
Size: 172 KB
Click to Enlarge

Name: Screenshot5.png
Size: 176 KB
 
 
  • Post #4
  • Quote
  • Jan 9, 2020 3:04pm Jan 9, 2020 3:04pm
  •  StudentofSoc
  • | Commercial Member | Joined Jan 2020 | 147 Posts
Quoting matthew89
Disliked
OK, this looks very interesting. Thanks for sharing Student of Soc.
Ignored

Thanks, lets get some trades going
 
 
  • Post #5
  • Quote
  • Jan 9, 2020 3:09pm Jan 9, 2020 3:09pm
  •  Geester
  • | Joined Jul 2017 | Status: Member | 192 Posts
Interesting stuff! Would like to understand more about this if you are able to provide more logic behind the approach. Thanks for sharing this!
 
 
  • Post #6
  • Quote
  • Jan 9, 2020 3:18pm Jan 9, 2020 3:18pm
  •  StudentofSoc
  • | Commercial Member | Joined Jan 2020 | 147 Posts
Quoting Geester
Disliked
Interesting stuff! Would like to understand more about this if you are able to provide more logic behind the approach. Thanks for sharing this!
Ignored
Most definitely,

I am working on a user-guide that will cover the methology of SoS, I will post it as soon as its ready.

In the meantime you can check out this Technical Anlaysis .pdf by Martin Armstrong.
Under "Break Line Channel" you will learn how the channels are constructed etc.
Attached File(s)
File Type: pdf MANUAL-TechnicalAnalysis.pdf   3.7 MB | 295 downloads
 
1
  • Post #7
  • Quote
  • Jan 9, 2020 3:18pm Jan 9, 2020 3:18pm
  •  Geester
  • | Joined Jul 2017 | Status: Member | 192 Posts
What does 9/13 constitute?
 
 
  • Post #8
  • Quote
  • Jan 9, 2020 3:19pm Jan 9, 2020 3:19pm
  •  Geester
  • | Joined Jul 2017 | Status: Member | 192 Posts
Quoting StudentofSoc
Disliked
{quote} Most definitely, I am working on a user-guide that will cover the methology of SoS, I will post it as soon as its ready. In the meantime you can check out this Technical Anlaysis .pdf by Martin Armstrong. Under "Break Line Channel" you will learn how the channels are constructed etc. {image}
Ignored
Many thanks, will do!
 
1
  • Post #9
  • Quote
  • Jan 9, 2020 3:22pm Jan 9, 2020 3:22pm
  •  StudentofSoc
  • | Commercial Member | Joined Jan 2020 | 147 Posts
Quoting Geester
Disliked
What does 9/13 constitute?
Ignored
9 and 13 are exhaustion patterns, are you familiar with TD Combo? Its the work of Thomas DeMark.
They can be used to identify potential turning points in the market, or at least exhaustions.
 
 
  • Post #10
  • Quote
  • Jan 9, 2020 4:06pm Jan 9, 2020 4:06pm
  •  acetrader
  • Joined Feb 2006 | Status: Member | 1,656 Posts | Online Now
SOS, Spot on my friend....your own SOS thread. Great idea for SOS & your thread.


I wish your the best. Welcome those that help & expel those that hinder your progress.
 
1
  • Post #11
  • Quote
  • Jan 9, 2020 4:10pm Jan 9, 2020 4:10pm
  •  StudentofSoc
  • | Commercial Member | Joined Jan 2020 | 147 Posts
Quoting acetrader
Disliked
SOS, Spot on my friend....your own SOS thread. Great idea for SOS & your thread. I wish your the best. Welcome those that help & expel those that hinder your progress.
Ignored
Thanks bro
 
 
  • Post #12
  • Quote
  • Jan 9, 2020 6:57pm Jan 9, 2020 6:57pm
  •  Geester
  • | Joined Jul 2017 | Status: Member | 192 Posts
Quoting StudentofSoc
Disliked
{quote} 9 and 13 are exhaustion patterns, are you familiar with TD Combo? Its the work of Thomas DeMark. They can be used to identify potential turning points in the market, or at least exhaustions.
Ignored
No, I am not familiar with TD Combo but I have just Googled so will find out soon (hopefully!). Lots to learn and I'm looking forward to the journey
 
1
  • Post #13
  • Quote
  • Jan 9, 2020 7:40pm Jan 9, 2020 7:40pm
  •  StudentofSoc
  • | Commercial Member | Joined Jan 2020 | 147 Posts
Quoting StudentofSoc
Disliked
Ok, posting the first trade, one of many more to come! AUD/JPY Short Term Analysis Starting from the right on the 4hr chart price closed back inside the channel, creating what looks like a bullish V Shape. The middle chart, 1hr, is showing a bounce off cyclical support indicating a likely advance to the upside. Going down one more time frame, arriving at the 30 min chart (to the left) there is a bullish 9 price flip which seems to be buncing off current support as well. I am going long with a Stop loss @ 74.9546 which is the risk level associated...
Ignored
AUD/JPY Short Term Analysis - Follow Up
We just reached and exceded our target and first price projection. Great! Woho!
The trade is now closed, however it seems to have potential to go even further, but this blog objective is to make money and learn about SoS, not to catch every single $ (greed).

Result: Collected+21 pips on this trade. Super!

Moving on to the next trade...
Attached Image (click to enlarge)
Click to Enlarge

Name: Screenshot1.png
Size: 174 KB
 
 
  • Post #14
  • Quote
  • Jan 9, 2020 9:39pm Jan 9, 2020 9:39pm
  •  StudentofSoc
  • | Commercial Member | Joined Jan 2020 | 147 Posts
Here is a very basic user guide for SoS!
Hope you find it easy and straight forward.
I did not put too many examples in at the end because I thought we will cover them here in the thread as we trade.
Attached File(s)
File Type: pdf Student of Socrates SoS Basic User Guide.pdf   698 KB | 314 downloads
 
1
  • Post #15
  • Quote
  • Jan 10, 2020 6:13am Jan 10, 2020 6:13am
  •  StudentofSoc
  • | Commercial Member | Joined Jan 2020 | 147 Posts
Quoting Geester
Disliked
{quote} No, I am not familiar with TD Combo but I have just Googled so will find out soon (hopefully!). Lots to learn and I'm looking forward to the journey
Ignored
Awesome, great to have you on board!
 
1
  • Post #16
  • Quote
  • Edited Apr 8, 2022 8:27am Jan 10, 2020 7:48am | Edited Apr 8, 2022 8:27am
  •  StudentofSoc
  • | Commercial Member | Joined Jan 2020 | 147 Posts
I have made a Capital Flow Model which can be used to identify emerging trends and potential breakouts in the FX market.
It analyzes the incoming and outcoming capital flow of the 8 major currencies; EUR, USD, CAD, AUD, NZD, CHF, GBP and JPY.
...a great tool to help traders find opportunity on all time frames!

You can double-click on the symbols in the panel to immediately open the chart.
In settings, write the name of the template you want charts to open with.

This Model will be merged with SoS in the future and will write its own commentary for each currency.
Pretty tricky stuff with the commentary so you have to be patient with this one, however a very cool and useful feature that I am looking forward to release it in the future.

(info)
Features

  1. Personal Template Option
  2. Sound Alert on New Data
  3. Quick Access to Charts
  4. Countdown Timer


Parameters

  1. Name of Template: (write the name of the template you want charts to open with)
  2. Color New Uptrend: LightSkyBlue
  3. Color New Downtrend: LightPink
    Attached Image (click to enlarge)
    Click to Enlarge

Name: Screenshot1.png
Size: 26 KB
    Attached Image (click to enlarge)
    Click to Enlarge

Name: Screenshot2.png
Size: 204 KB

{ copyrighted attachment deleted by staff }

 
1
  • Post #17
  • Quote
  • Jan 10, 2020 8:26am Jan 10, 2020 8:26am
  •  Geester
  • | Joined Jul 2017 | Status: Member | 192 Posts
The SoS indicator paints Salmon lines but they are not colour specified in the indicator's input properties. What do the Salmon lines represent? Thank you!
 
 
  • Post #18
  • Quote
  • Jan 10, 2020 8:35am Jan 10, 2020 8:35am
  •  StudentofSoc
  • | Commercial Member | Joined Jan 2020 | 147 Posts
Quoting Geester
Disliked
The SoS indicator paints Salmon lines but they are not colour specified in the indicator's input properties. What do the Salmon lines represent? Thank you!
Ignored
The Salmon and LightSkyBlue color represent the most recent (short term) cyclical derived channels, while the LightGreen and CadetBlue are majors (long term).
 
 
  • Post #19
  • Quote
  • Jan 10, 2020 8:54am Jan 10, 2020 8:54am
  •  Geester
  • | Joined Jul 2017 | Status: Member | 192 Posts
Quoting StudentofSoc
Disliked
{quote} The Salmon and LightSkyBlue color represent the most recent (short term) cyclical derived channels, while the LightGreen and CadetBlue are majors (long term).
Ignored
Ahh, thanks. I missed that completely. So, the channel colours are all "fixed".
 
 
  • Post #20
  • Quote
  • Jan 10, 2020 8:59am Jan 10, 2020 8:59am
  •  Geester
  • | Joined Jul 2017 | Status: Member | 192 Posts
Is there a specific approach that the indicator takes to determine highs and lows on which to base the channels? The Socrates document has rules to take out the ambiguity of drawing the trend lines but there are different determinations of what constitutes a bar pattern for a high and a low. Interested to understand how SoS deems a high/low pattern. Thanks
 
 
  • Commercial Content
  • /
  • Student of Socrates (SoS)
  • Reply to Thread
    • Page 1 23456 10
    • Page 1 234 10
0 traders viewing now
  • More
Top of Page
  • Facebook
  • Twitter
About FF
  • Mission
  • Products
  • User Guide
  • Media Kit
  • Blog
  • Contact
FF Products
  • Forums
  • Trades
  • Calendar
  • News
  • Market
  • Brokers
  • Trade Explorer
FF Website
  • Homepage
  • Search
  • Members
  • Report a Bug
Follow FF
  • Facebook
  • Twitter

FF Sister Sites:

  • Metals Mine
  • Energy EXCH
  • Crypto Craft

Forex Factory® is a brand of Fair Economy, Inc.

Terms of Service / ©2023