• Home
  • Forums
  • Trades
  • News
  • Calendar
  • Market
  • Brokers
  • Login
  • Join
  • User/Email: Password:
  • 3:25am
Menu
  • Forums
  • Trades
  • News
  • Calendar
  • Market
  • Brokers
  • Login
  • Join
  • 3:25am
Sister Sites
  • Metals Mine
  • Energy EXCH
  • Crypto Craft

Options

Bookmark Thread

First Page First Unread Last Page Last Post

Printable Version

Similar Threads

Successful Fundamentals trading (DAY Trading WILL BE Ignored) 17 replies

second order ignored 0 replies

  • Trading Journals
  • /
  • Reply to Thread
  • Subscribe
  • 739
Attachments: COT: The precious data ignored
Exit Attachments

COT: The precious data ignored
  • Last Post
  •  
  • 1 Page 23456 28
  • 1 Page 234 28
  •  
  • Post #21
  • Quote
  • Edited at 8:43am Jan 8, 2020 8:12am | Edited at 8:43am
  •  kuroro001
  • Joined Jul 2007 | Status: Member | 17,077 Posts
Platinium
Attached Image


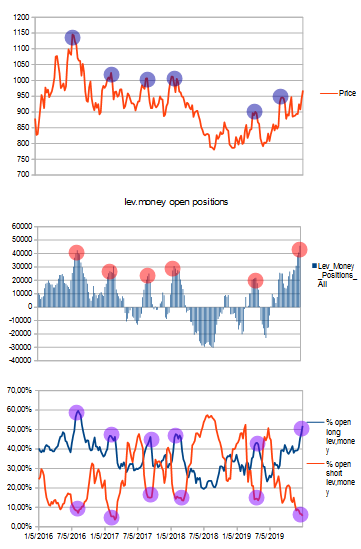
Charts speak for itself.

Everytime we had an increase in the net longs from the managed money, we had sell off. History repeats itself ?

What you can see here? open longs are being increased above 50%, while shorts are being decreased to 5%. Spread is very large

Another point to look at is the strength of the open longs & open shorts. Let me explain.
Whenever the open longs are very important, we can large decline (1st blue point in 2016 & 4th one in 2018).
Whenever the open longs are less important, decline are lesser because they are not enough contrarian longs to bring market down.

Today, open longs are increasing a lot, meaning we could have large decline over the next couple of months.
What i don't like is the price structure with higher highs and higher lows.

Price action will be right ? COT will be right ?
Correction in the process for every precious metals or just the start of a bull run ?
COT : the precious data ignored & FX investing: mid/long term ideas
  • Post #22
  • Quote
  • Edited at 4:28pm Jan 8, 2020 3:30pm | Edited at 4:28pm
  •  kuroro001
  • Joined Jul 2007 | Status: Member | 17,077 Posts
Wheat
Attached Image


Here is an example of how relative spread between long & short managed money can be used.

Its just a "small" chart from 01/01/2016 until 31/12/2019, 4 years timeframe

There is 2 ways, either trade it when the spread is above 10%, or when its above 30%
You'll get less signals with a higher spread

Red dots = spread higher than 30%
Green dots = spread higher than 10%

This is just an example for only 4 years data for the wheat commodity
COT : the precious data ignored & FX investing: mid/long term ideas
  • Post #23
  • Quote
  • Edited Jan 10, 2020 6:28am Jan 9, 2020 6:39am | Edited Jan 10, 2020 6:28am
  •  kuroro001
  • Joined Jul 2007 | Status: Member | 17,077 Posts
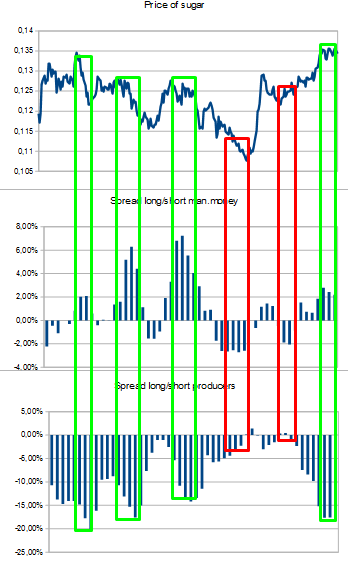
Sugar
Attached Image


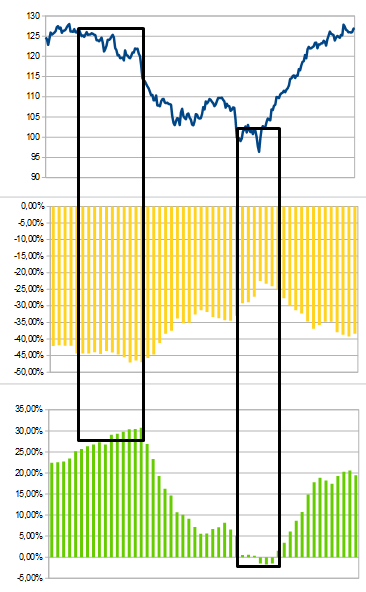
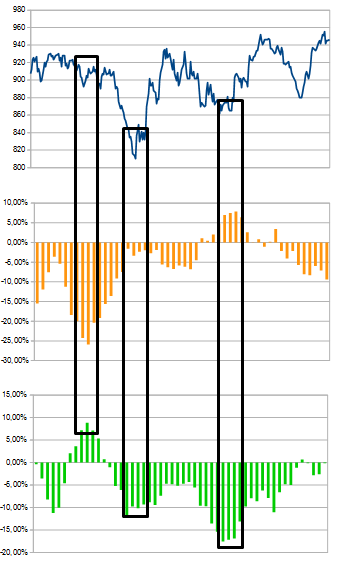
Another example on how COT report can be used efficiently.

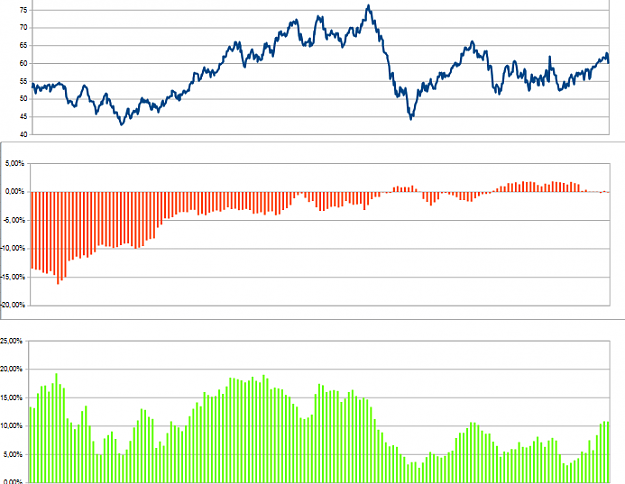
There are 3 charts :
Price of sugar commodity
Spread between producers open longs / procucers open short
Spread between managed money open long / managed money open short

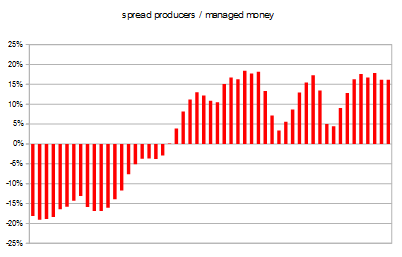
What can we see on chart ? Everytime the spread increase for both producers & managed money, there is a reversal in price

Green rectangles are when managed producers is increasing above 10%, ideally above 15% (open long - open short = minus 15% because shorts are stronger) & when managed money increase spread above 2% (when longs are stronger).
Red rectangles are drawn whenever the spread increase negatively for the managed money below 2%. While the spread of producers is increasing towards 0%, best positive

If we have a look at the situation at year end....spread for man.money is above 2%, longs appear to be very strong (and wrong), while producers spread is near 20% negative, which means producers short a lot of sugar to hedge their long.

If history repeats itself, sugar is on the short side, meaning we should short any rallies (following a good money management, looking at price action, any indicator, extreme sentiment) because both spreads are very high
COT : the precious data ignored & FX investing: mid/long term ideas
  • Post #24
  • Quote
  • Edited at 9:06am Jan 9, 2020 7:48am | Edited at 9:06am
  •  kuroro001
  • Joined Jul 2007 | Status: Member | 17,077 Posts
British pound
Attached Image


i won't explain what the chart says, it does on its own
COT : the precious data ignored & FX investing: mid/long term ideas
  • Post #25
  • Quote
  • Jan 9, 2020 8:56am Jan 9, 2020 8:56am
  •  kuroro001
  • Joined Jul 2007 | Status: Member | 17,077 Posts
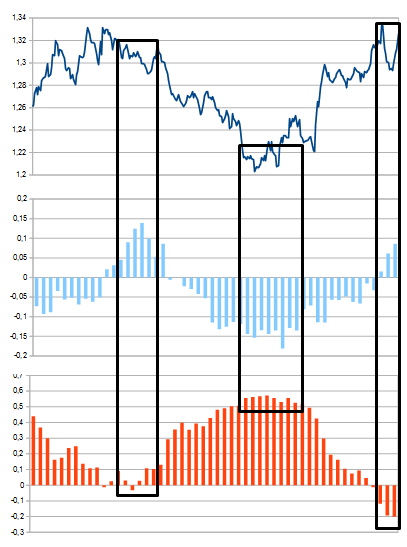
Wti oil
Attached Image


We know why oil couldn't keep up with his "bullish" move. Producers were not long at all, while money managers are ultra longs.

Rest is up to any interpretation
COT : the precious data ignored & FX investing: mid/long term ideas
1
  • Post #26
  • Quote
  • Jan 9, 2020 8:59am Jan 9, 2020 8:59am
  •  kuroro001
  • Joined Jul 2007 | Status: Member | 17,077 Posts
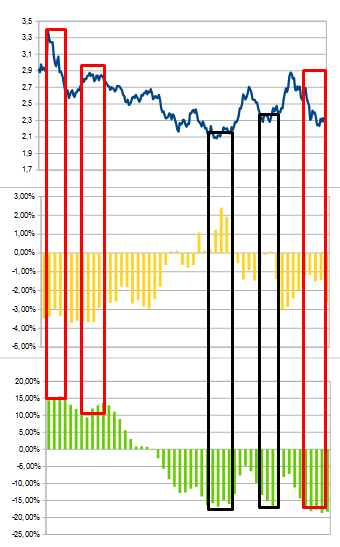
Natural gas
Attached Image


As usual, whenever producers are very short while money managers are very long, its a recipe for shorting for the market
Whenever the opposite? do the opposite

For the moment, money managers are very shorts, while producers are shorts too. I'd wait for producers to start reversing from short to long.
When they do, reversal/correction up will occur if money managers stay that short
COT : the precious data ignored & FX investing: mid/long term ideas
  • Post #27
  • Quote
  • Jan 9, 2020 11:30am Jan 9, 2020 11:30am
  •  renNstimpy
  • Joined Nov 2019 | Status: Member | 330 Posts
Quoting kuroro001
Disliked
Natural gas {image} As usual, whenever producers are very short while money managers are very long, its a recipe for shorting for the market Whenever the opposite? do the opposite For the moment, money managers are very shorts, while producers are shorts too. I'd wait for producers to start reversing from short to long. When they do, reversal/correction up will occur if money managers stay that short
Ignored
~~~
Attached Image (click to enlarge)
Click to Enlarge

Name: movement.png
Size: 140 KB
  • Post #28
  • Quote
  • Jan 9, 2020 11:35am Jan 9, 2020 11:35am
  •  kuroro001
  • Joined Jul 2007 | Status: Member | 17,077 Posts
Quoting renNstimpy
Disliked
{quote} ~~~ {image}
Ignored
What's your view on this ? buying opportunity ?
COT : the precious data ignored & FX investing: mid/long term ideas
  • Post #29
  • Quote
  • Jan 9, 2020 11:37am Jan 9, 2020 11:37am
  •  kuroro001
  • Joined Jul 2007 | Status: Member | 17,077 Posts
Live cattle
Attached Image


Today's situation, we are still seeing increasing of the spread long/short of money managers. They are not that high, but could be good enough for a retrace in this market as producers are increasing their shorts as well.
COT : the precious data ignored & FX investing: mid/long term ideas
  • Post #30
  • Quote
  • Jan 9, 2020 11:40am Jan 9, 2020 11:40am
  •  renNstimpy
  • Joined Nov 2019 | Status: Member | 330 Posts
Quoting kuroro001
Disliked
{quote} What's your view on this ? buying opportunity ?
Ignored
Wouldnt say that, but I absolutely am not looking to inverse after yesterday and overall market timing personally.
  • Post #31
  • Quote
  • Edited Jan 10, 2020 6:28am Jan 9, 2020 3:18pm | Edited Jan 10, 2020 6:28am
  •  kuroro001
  • Joined Jul 2007 | Status: Member | 17,077 Posts
Soybean
Attached Image


COT report is again giving good informations about the positions of the future market for commodities, in here Soybean.

Whenever producers are increasing their negative spread (more open shorts than open longs, decreasing long/increasing shorts, decreasing more longs than shorts, increasing more shorts than long), it means they are short hedging more & more.
Whenever money managers increase their longs too much, it tends to reverse at the extreme.
It was the case for the 3rd last tops/bottom.

Right now ? producers are holding shorts, increasing them so far. I just don't like the money managers, flat.
Ideally what should we see ? Another increase in short hedges for producers, while money managers increase their longs. Meaning price will rise (a lot?) before reversing it courses once extreme positions are there
COT : the precious data ignored & FX investing: mid/long term ideas
1
  • Post #32
  • Quote
  • Jan 10, 2020 3:13am Jan 10, 2020 3:13am
  •  kuroro001
  • Joined Jul 2007 | Status: Member | 17,077 Posts
wti 2017-2019
Attached Image (click to enlarge)
Click to Enlarge

Name: Screenshot_15.png
Size: 37 KB


crude oil price relation with producers & money managers
COT : the precious data ignored & FX investing: mid/long term ideas
  • Post #33
  • Quote
  • Jan 10, 2020 6:11am Jan 10, 2020 6:11am
  •  kuroro001
  • Joined Jul 2007 | Status: Member | 17,077 Posts
Attached Image


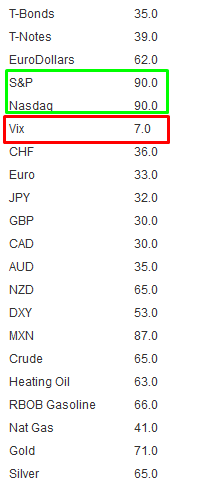
Market Sentiment as of yesterday. Extreme short in the VIX, correction could be imminent and appear anyday
COT : the precious data ignored & FX investing: mid/long term ideas
  • Post #34
  • Quote
  • Jan 10, 2020 6:36am Jan 10, 2020 6:36am
  •  kuroro001
  • Joined Jul 2007 | Status: Member | 17,077 Posts
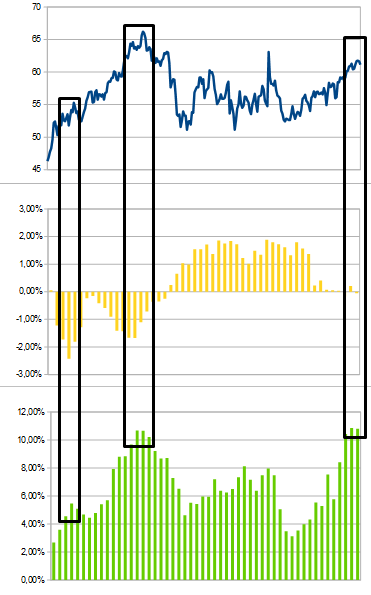
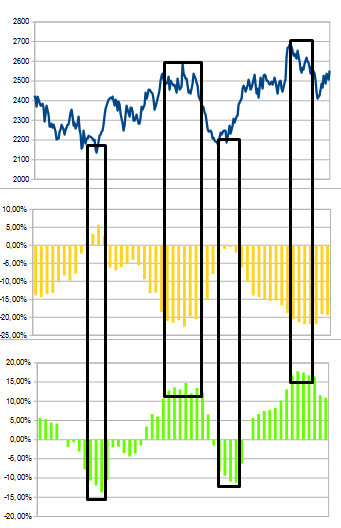
Cocoa
Attached Image


Chart above represent the price of the Cocoa for the year 2019, with the positionning from the producers (yellow) & money managers (green)

Producers are good at spotting reversal/correction at the extreme. Whenever they are very long, prices go up.
Money managers are trend followers, they rise their long when prices go up until it reaches an extreme for them. Then they need to clear their long, hence it falls.

When both producers & money managers agree, its the best recipe for a strong move.

Chart speaks for itself, but what to do lately?
Both procuders & money managers have cleared some positions, but its still very strong. I would short rallies as price go up, and hopefully producers will increase their shorts, while money managers increase their longs, which would be a strong reversal up there
COT : the precious data ignored & FX investing: mid/long term ideas
  • Post #35
  • Quote
  • Jan 11, 2020 10:43am Jan 11, 2020 10:43am
  •  kuroro001
  • Joined Jul 2007 | Status: Member | 17,077 Posts
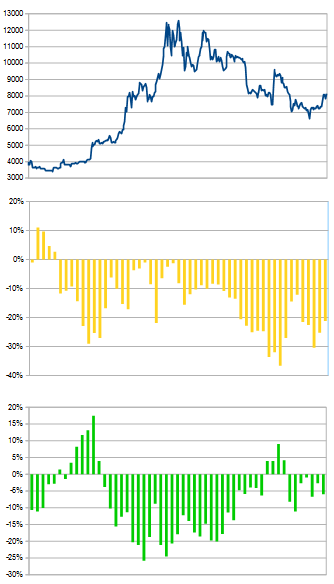
Bitcoin
Attached Image


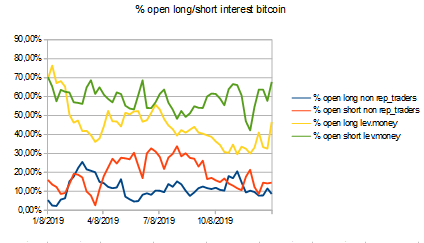
I'll start off with the bitcoin analysis. This first chart shows the open longs & shorts positions from both money managers and a small group of non reportable traders. Money managers is understandable, but why the small group of traders? Because first, the dealers are not involved in trading bitcoins on the future market, and second because we know small traders are often wrong. We can "use" them to try to know what not to do.

In the money manager's view (lev_money yellow and green line), we can see both longs & shorts increasing their positions, with a stronger increase for the long side. But overall shorts are still near the 70% of the open interest, which means a lot of money managers bet on the fall of the bitcoin. We know they are wrong most of the time
In the small trader's view, their view is lighter, both longs & shorts are near the same level, they look lost. Since august last year they have been decreasing their shorts while bitcoin fell, go wonder how wrong they have been.

Attached Image


This second chart shows the spread between longs & shorts money managers, and spread between longs & shorts small traders.
At a glance, we can see how both can be right or wrong. Money managers (yellow) are very wrong most of the time, and worst at its extreme, signaling a top/bottom.
Small traders (green) are right for a moment, then totally wrong. They need to be used a contrarian indicator

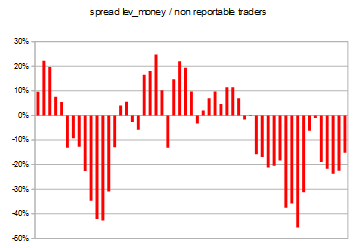
Attached Image


This last charts show the spread between the positions of the money managers versus the small traders.
When the spread hits strongly the negative territory, bitcoin rises, when spread hitting the positive territory, traders are positionned as shorts.

For now, bitcoin is on the rise, as spread is negative. It should rise more for the weeks ahead, until spread reverses. When the spread goes positive, we'll have to clear long trades as prices rises until spreads has increased now for the price to go lower again
COT : the precious data ignored & FX investing: mid/long term ideas
  • Post #36
  • Quote
  • Jan 11, 2020 11:41am Jan 11, 2020 11:41am
  •  kuroro001
  • Joined Jul 2007 | Status: Member | 17,077 Posts
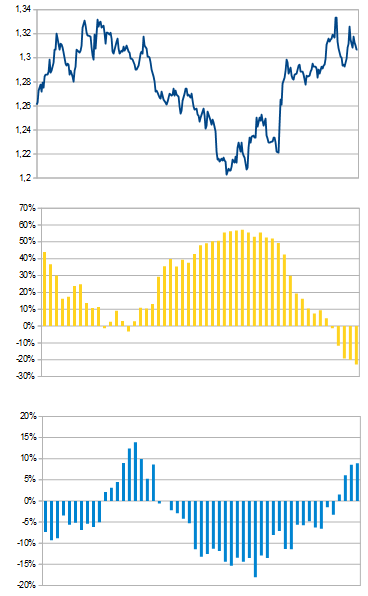
British pound

Attached Image


Lets have a look at the british pound. This first chart shows the open longs & shorts positions from both dealers and money managers (leverage funds).
Dealers understand well the market, they know tops/bottom as they increase much there, the opposite of the money managers, increasing on top, decreasing on bottom.

In the dealers's view (dealers red and blue line), we can see shorts increased their positions, while longs decreases them. GBP operators are looking at the price down
In the money manager's view (lev.money yellow and green line), longs are 10% stronger than shorts. Longs increasing strongly, while shorts decreasing more slowly. This will be needed to be monitored


Attached Image


This second chart shows the spread between longs & shorts money managers, and spread between longs & shorts dealers.
Both are very important, dealers are top/bottom finders, while money managers are trend followers and very wrong at top/bottom.
At the present day, both are increasing their positions, dealers increase their shorts, leverage funds increase their longs. They are in sync, which means for now the downside prevails

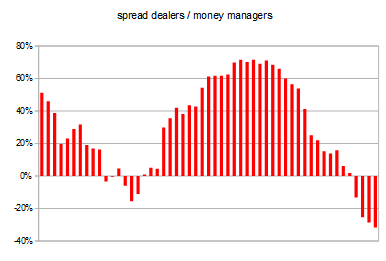
Attached Image


This last charts show the spread between the positions of the dealers versus the money managers.
When the spread hits the negative territory, GBP falls, when spread hitting the positive territory, traders are positionned as stronger longs than shorts, hence the rise of GBP

For now, GBP is falling, as spread is negative. It could fall more for the weeks ahead, until spread reverses positive or at least increase towards 0.
COT : the precious data ignored & FX investing: mid/long term ideas
  • Post #37
  • Quote
  • Jan 11, 2020 12:15pm Jan 11, 2020 12:15pm
  •  kuroro001
  • Joined Jul 2007 | Status: Member | 17,077 Posts
Euro

Attached Image


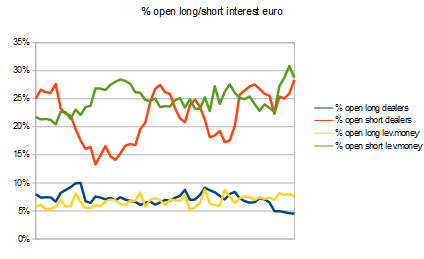
Euro analysis for the following week. This first chart shows the open longs & shorts positions from both dealers and money managers (leverage funds).

In the dealers's view (dealers red and blue line), we can see shorts increased their positions at a level higher than the whole 2019, while longs decreases them below 5%, its barely nothing. EUR operators are looking at the price down for the moment
In the money manager's view (lev.money yellow and green line), longs are very weak, flat for the moment, its at the same level at the whole 2019.
Open shorts are very high, cooling off the highs so far. Whenever they are too high, its time for price to reverse.


Attached Image


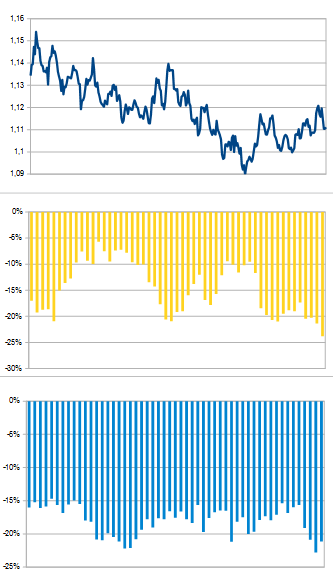
This second chart shows the spread between longs & shorts money managers, and spread between longs & shorts dealers.
Both are very important, dealers are top/bottom finders, while money managers are trend followers and very wrong at top/bottom.
At the present day, both are very into the negative side. Both below 20%. But we can see dealers are increasing shorts, while money managers are decreasing a bit. From the money manager's view we should get a bounce, from the dealers it should keep diving

Attached Image


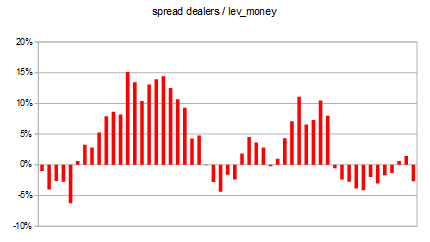
This last charts show the spread between the positions of the dealers versus the money managers.
When the spread hits the negative territory, euro falls, when spread hitting strongly the positive territory, traders are positionned as stronger longs than shorts, hence the rise of euro

For now, euro is falling, as spread is negative. We should watch out here because the spread is not very strong into negative. In the past it fells, but longs have been accumulated way bigger than shorts.

Lets be cautious with euro, it could continue to fall, with big bounces ahead
COT : the precious data ignored & FX investing: mid/long term ideas
  • Post #38
  • Quote
  • Jan 11, 2020 2:04pm Jan 11, 2020 2:04pm
  •  kuroro001
  • Joined Jul 2007 | Status: Member | 17,077 Posts
Crude

Attached Image


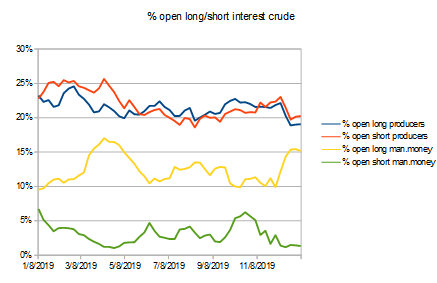
Crude analysis for the following week. This first chart shows the open longs & shorts positions from both producers and money managers (managed funds).

In the producer's view (producers red and blue line), we can see shorts increased their positions at small level, while longs stay flat. Crude operators are still bearish for the moment
In the money manager's view (man.money yellow and green line), both long & shorts are flat for the past week. With open longs staying at high levels near 15%. Overall, net longs are high, meaning we could see more downside.

Attached Image


This second chart shows the spread between longs & shorts money managers, and spread between longs & shorts producers.
Both are very important, producers are top/bottom finders, while money managers are trend followers and very wrong at top/bottom.
At the present day, producers are below 0, net shorts and eyeing for more downside. While managed money are very long, if prices ever go up, managed money will surely increase their open buy to extreme level, which will make prices fall hard.

Attached Image


This last charts show the spread between the positions of the producers versus the money managers.
When the spread hits the negative territory, crude falls, while a positive spread should help the rise.
For the whole 2019 year, spread has been negative, meaning operators have been seeing a fall for the whole 2019 year, no matter how high it rose.
At this level, operators are expecting more fall in prices
COT : the precious data ignored & FX investing: mid/long term ideas
1
  • Post #39
  • Quote
  • Jan 11, 2020 3:18pm Jan 11, 2020 3:18pm
  •  kuroro001
  • Joined Jul 2007 | Status: Member | 17,077 Posts
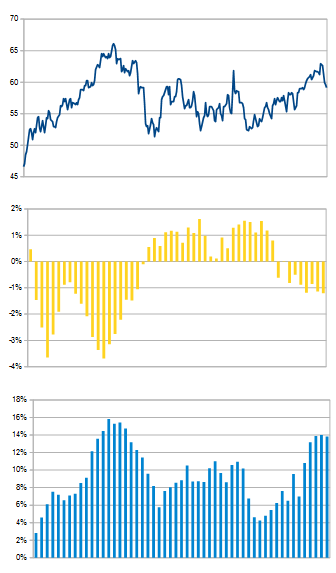
Natural gas

Attached Image


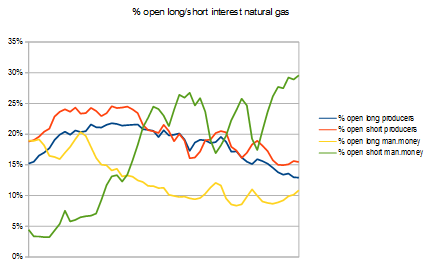
Natural gas analysis for the following week. This first chart shows the open longs & shorts positions from both producers and money managers (managed funds).

In the producer's view (producers red and blue line), we can see longs keep decreasing their positions, its on a downtrend, while shorts stay flat. Gas operators are not taking a strong bias. They are decreasing their open long (closing them up), but are not really increasing their shorts (not believing in a strong down move).
In the money manager's view (man.money yellow and green line), both longs & shorts are increasing their open positions, with a strong increase of shorts over the past couple of weeks, hitting near 30%. All of this suggest a very near end of the downove

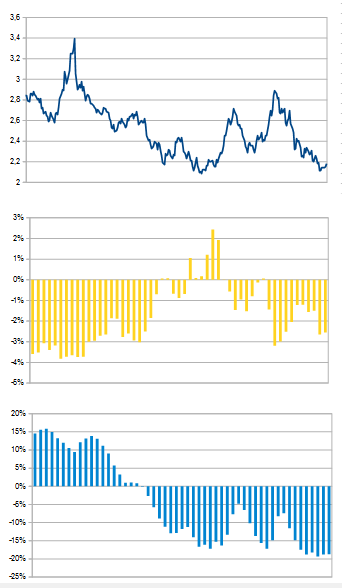
Attached Image


This second chart shows the spread between longs & shorts money managers, and spread between longs & shorts producers.
Both are very important, producers are top/bottom finders, while money managers are trend followers and very wrong at top/bottom.
At the present day, producers are below 0, net shorts and eyeing for more downside. Managed money are very short too, more short than producers.
When both goes the same way its a strong move until one of them make a different move to change the trend

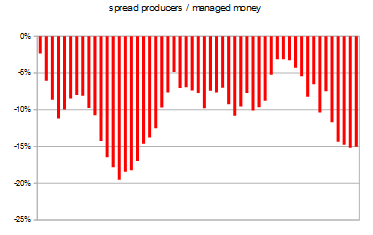
Attached Image


This last charts show the spread between the positions of the producers versus the money managers.
When the spread hits the negative territory, natural gas falls, while a positive spread should help the rise.
Spread is strongly above 0% for some months already, preventing prices from going down further. IMO, once producers are ready natural gas will clear all the resistance and go back towards 3 dollars
COT : the precious data ignored & FX investing: mid/long term ideas
2
  • Post #40
  • Quote
  • Jan 12, 2020 3:35am Jan 12, 2020 3:35am
  •  mga35
  • | Joined Mar 2019 | Status: Follow the Big Money | 177 Posts
Quoting kuroro001
Disliked
Crude {image} Crude analysis for the following week. This first chart shows the open longs & shorts positions from both producers and money managers (managed funds). In the producer's view (producers red and blue line), we can see shorts increased their positions at small level, while longs stay flat. Crude operators are still bearish for the moment In the money manager's view (man.money yellow and green line), both long & shorts are flat for the past week. With open longs staying at high levels near 15%. Overall, net longs are high, meaning we...
Ignored
I have a humble question, could you elaborate more on what's the difference between producers and money managers? Is it the case that producers represent hedge funds where their positions are mostly to hedge the oil prices? On the other hand, money managers represent big banks where they speculate on oil prices?
  • Trading Journals
  • /
  • COT: The precious data ignored
  • Reply to Thread
    • 1 Page 23456 28
    • 1 Page 234 28
0 traders viewing now
  • More
Top of Page
  • Facebook
  • Twitter
About FF
  • Mission
  • Products
  • User Guide
  • Media Kit
  • Blog
  • Contact
FF Products
  • Forums
  • Trades
  • Calendar
  • News
  • Market
  • Brokers
  • Trade Explorer
FF Website
  • Homepage
  • Search
  • Members
  • Report a Bug
Follow FF
  • Facebook
  • Twitter

FF Sister Sites:

  • Metals Mine
  • Energy EXCH
  • Crypto Craft

Forex Factory® is a brand of Fair Economy, Inc.

Terms of Service / ©2021