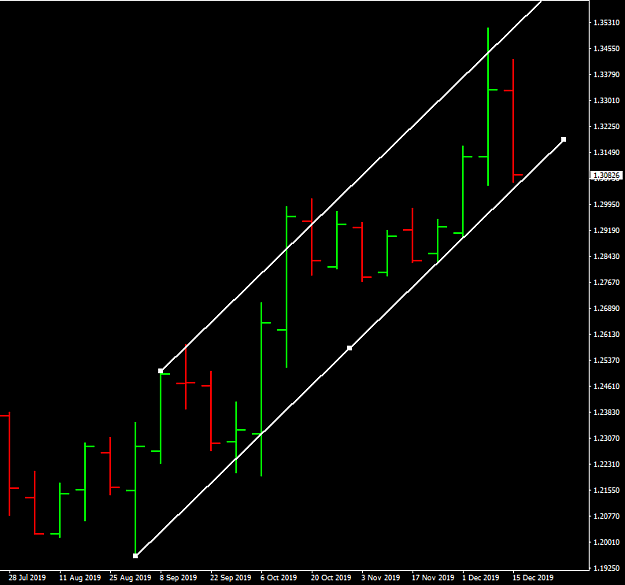
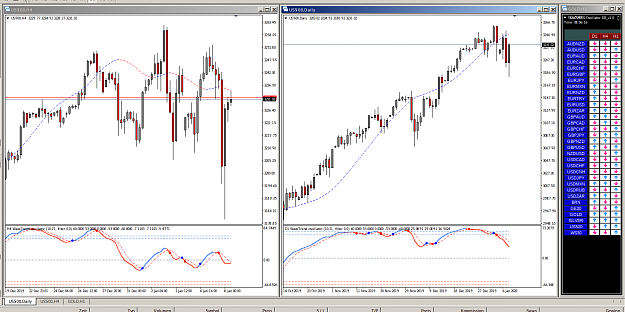
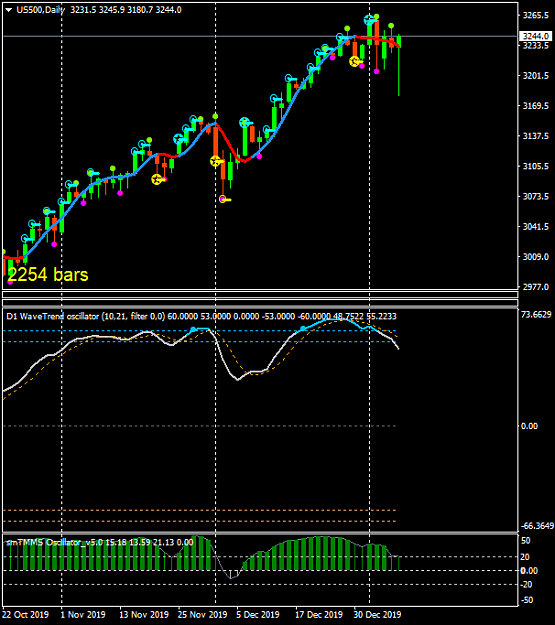
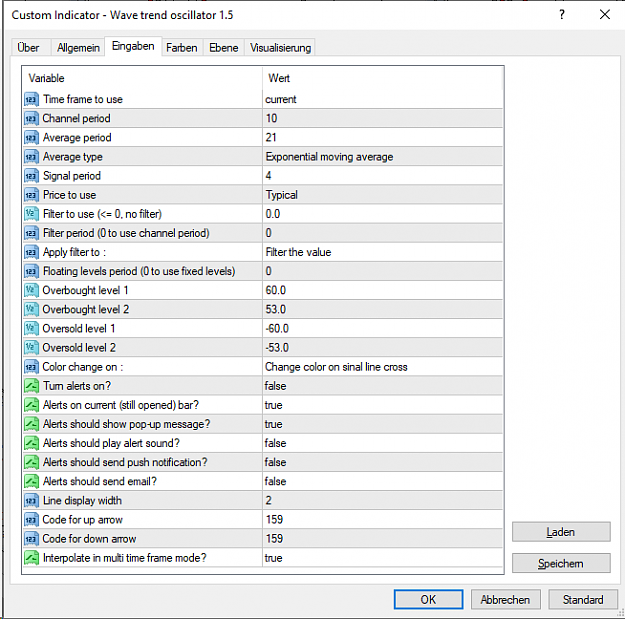
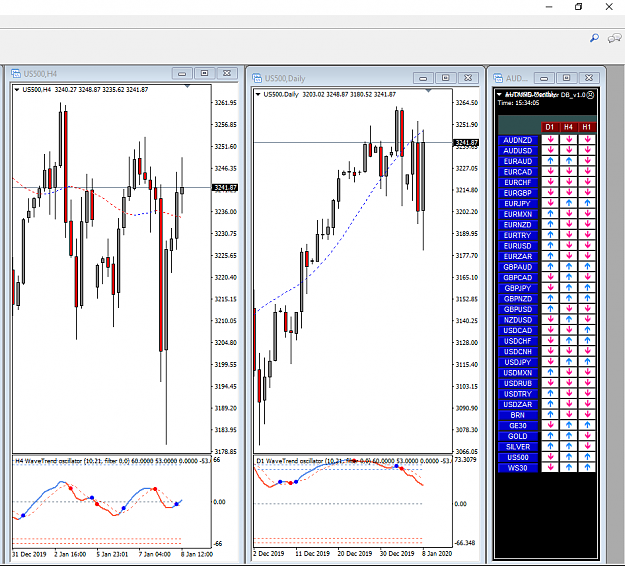
Dislikedjosi Because I only trade the Gbp/Usd I also check out confluence, so to keep my brain ticking over I run 4 different methods/systems on 9 time-frames so that's actually 36 charts I look at just to make a trade on one pair, I suppose it's sad really, but that's what I call fun {image} {image} {image} {image}Ignored
so you also had no exit signal and hopefully stayed in until you reached, well, not the moon but a new high - Stoch on all time frame says
it will soon be over but I'm sure you'll have the same fun on the downward slope.
One question only: don't all the charts above reflect more or less the same things a) momentum, b) support & resistance?
If so - why all of them?
Attached Image