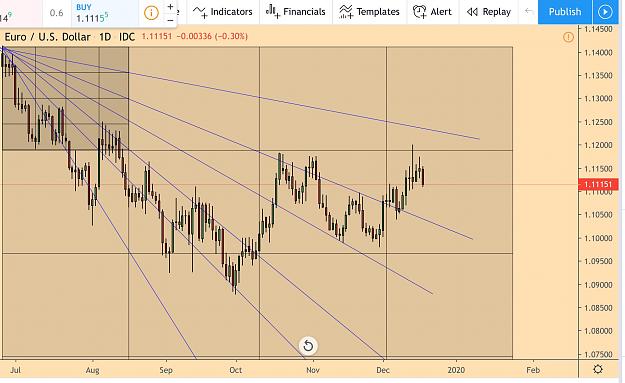
Here is the follow up on the euro chart from post 1036....as you can see it proved to be a strong area of resistance ....hitting short term support now due to market structure so we will keep an eye on it
Here is the follow up on the euro chart from post 1036....as you can see it proved to be a strong area of resistance ....hitting short term support now due to market structure so we will keep an eye on it {image}
Ignored
thanks for the chart Swede may i ask you i am trying to duplicate this in tradingview do you have to fix the scaling ? also which one of the gann box you use they have tree in tradingview Gann Box;Gann Square;Gann Square fix; thank you in advance ciao
{quote} thanks for the chart Swede may i ask you i am trying to duplicate this in tradingview do you have to fix the scaling ? also which one of the gann box you use they have tree in tradingview Gann Box;Gann Square;Gann Square fix; thank you in advance ciao
Ignored
I simply reset each time I log on.....I just use the Gann box but not saying the others do not have merit. Simple is better for a simple mind and I’m experimenting constantly. The images I post are my standard layout, easy to read and always alert me to areas of interest..ciao!
{quote} I simply reset each time I log on.....I just use the Gann box but not saying the others do not have merit. Simple is better for a simple mind and I’m experimenting constantly. The images I post are my standard layout, easy to read and always alert me to areas of interest..ciao!
Ignored
thank you i am experimenting myself how did you make the bigger box
{quote} thank you i am experimenting myself how did you make the bigger box
Ignored
Same box.....a second one..overlaid, expanded out and across so the borders match the first box.....this gives you the expansion of the original impulse wave several levels out....you see the impulse wave is the key....any impulse wave that was not news release related will divulge a natural path forward...you have to experiment a bit, and the impulse wave should be in the direction of the overall trend...hope this helps a bit
{quote} Please assist me on how you managed to draw both circles and square on charts
Ignored
Quite difficult if you are only using mt4...suggest you use the free version of tradingview charts...they have a ton of Gann tools that make all this easy in comparison....
{quote} Same box.....a second one..overlaid, expanded out and across so the borders match the first box.....this gives you the expansion of the original impulse wave several levels out....you see the impulse wave is the key....any impulse wave that was not news release related will divulge a natural path forward...you have to experiment a bit, and the impulse wave should be in the direction of the overall trend...hope this helps a bit
Ignored
Definitely helps i just start reading Jenkins the Geometry of Market thank you
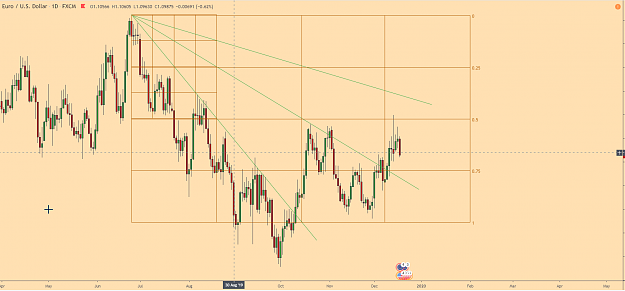
Swede reading Jenkins and seeing your picture i think i understood the 50% Jenkins talking thank you {image}
Ignored
For Jenkins 50% method, you draw an angle half of a low to high angle, from the low. Then draw a horizontal line exactly where the top intersects the half angle vertically. Vice versa for high to low.
{quote} Please assist me on how you managed to draw both circles and square on charts
Ignored
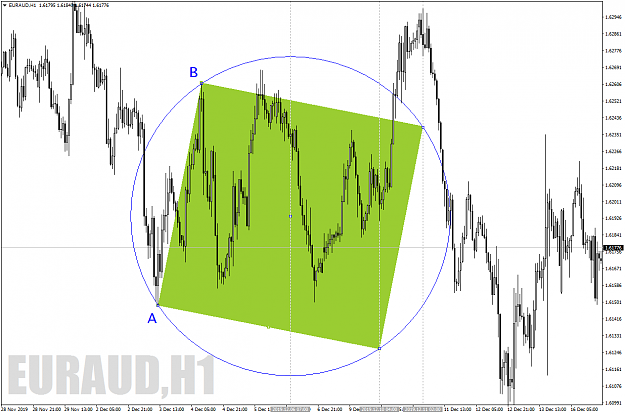
On MT4, you can use the Ellipse tool (scaled at 0.100) to draw a circle but you need to set the chart to Scale Fix One to One in the chart properties. Sadly these tools are not friendly enough to do this for the larger timeframes like the daily or weekly charts. (you can still do it though with some extra work).
In the EURAUD H1 chart, the start of the circle was anchored at A and the other end of the circle (opposite point) was pulled out until the first 90* point of the circle from A, going anti-clockwise, was fixed at B. As for the square, you can use a Channel tool and fix it to the 4 points of the circle. Hope this helps.
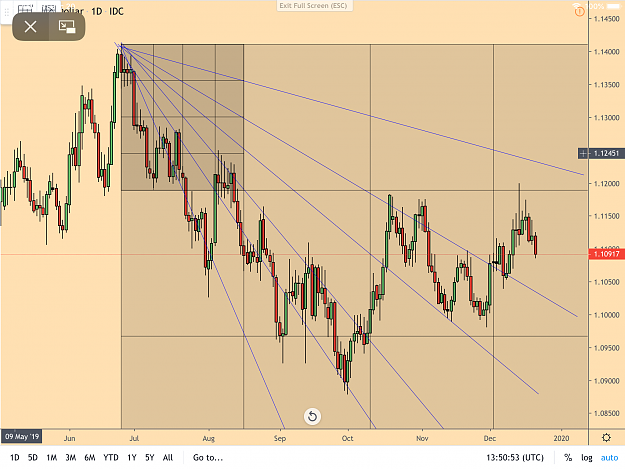
Here is the follow up on the euro chart from post 1036....as you can see it proved to be a strong area of resistance ....hitting short term support now due to market structure so we will keep an eye on it {image}
Ignored
turning into a very nice trade indeed thanks to a simple method to square an impulse wave...helps pay my resort bill this weekend .....
Artwork: Trading is about being creative, it is seeing something others don't see. It is using your mind to produce something. Many of you have the creative talents necessary much like drawing, using craftmanship and thinking outside of the box. I'd like to see what others on this thread have created with their hands and mind? Attached is some things I have made or reproduced. Show me you have done..... Don't be afraid to post something.... {image}
Ignored
After my wife lost her battle with cancer, I had a profound need to simply put something on canvas, create something to express pent up emotions, frustrations, happiness for what I had, sorrow for what I lost, anger for the struggle. Never cared to share it, never sold any of it but have had requests to commission. Some of it is nonsense, some of it only means something personal. Here are a few....most are 24” x 30” all acrylic
{quote} After my wife lost her battle with cancer, I had a profound need to simply put something on canvas, create something to express pent up emotions, frustrations, happiness for what I had, sorrow for what I lost, anger for the struggle. Never cared to share it, never sold any of it but have had requests to commission. Some of it is nonsense, some of it only means something personal. Here are a few....most are 24” x 30” all acrylic {image} {image} {image} {image} {image} {image} {image} {image}
Ignored
Hi Swede, just wanted to say, what lovely paintings you've created, i can only imagine the emotions that are in them, but can clearly see this when you look at them. Well done mate and my heart felt sympathy for the loss of your wife.
{quote} On MT4, you can use the Ellipse tool (scaled at 0.100) to draw a circle but you need to set the chart to Scale Fix One to One in the chart properties. Sadly these tools are not friendly enough to do this for the larger timeframes like the daily or weekly charts. (you can still do it though with some extra work). In the EURAUD H1 chart, the start of the circle was anchored at A and the other end of the circle (opposite point) was pulled out until the first 90* point of the circle from A, going anti-clockwise, was fixed at B. As for the square,...
Hi Guys, I'm back after a long trip. Glad, to see the thread once again. My voyage was non stop, interesting and accomplished something I wanted to achieve that took thirty years to come to fruition. I would like to say, there is no place like your own bed.
P
You NEVER will be the person you could be, without pressure & discipline
Hi all, i have a question which one i'm asking me since a moment regarding this technique. What defines the beginning of a good swing for geometry techniques? thank you
Ignored
I'll see if it has already established geometric relationships with past swing points. That'll give me some kind of confidence and high probability... but still, no guarantees