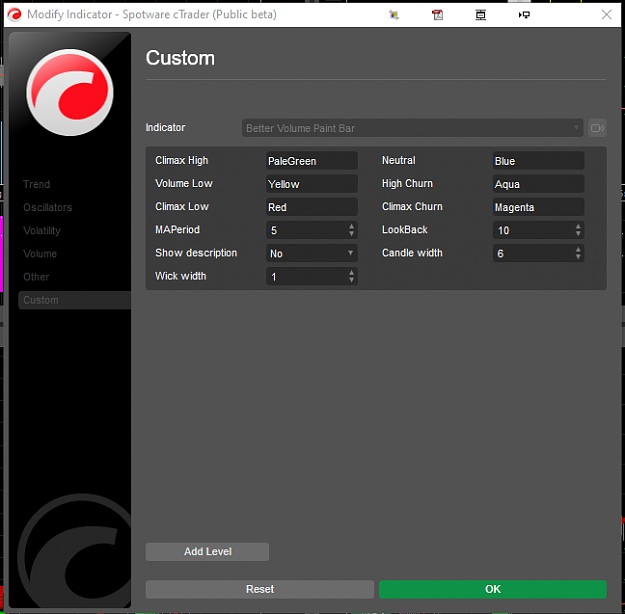
Disliked{quote} Yes I believe that is the correct one. You need to contact the proprietor and ask him to specifically include the function for Delta volume. It is a toggle switch in the settings. He was very helpful for me and allowed me to demo the indicator before I bought it. The nice thing is that after you buy it any and all further updates are included in the price.Ignored
If this works well in demo I am happy to purchase.
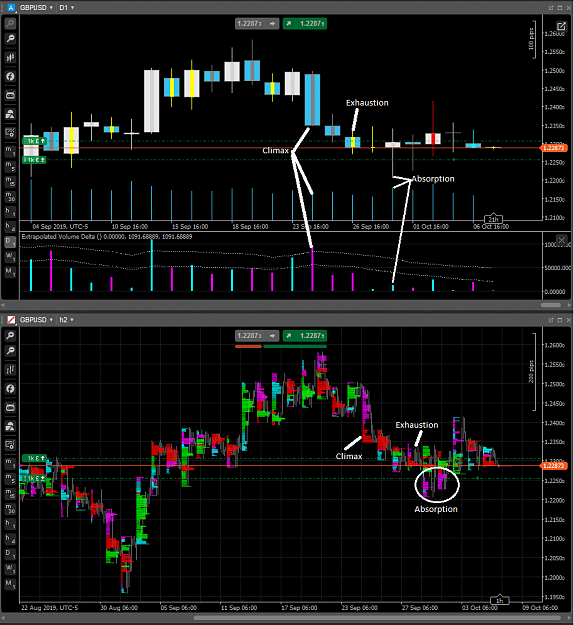
I have read this thread and hopefully will contribute soon. I found Anna Coulling’s volume analysis book fascinating, it shares some similar principles to this.
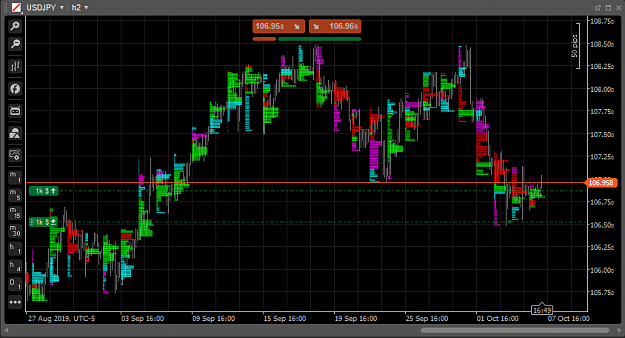
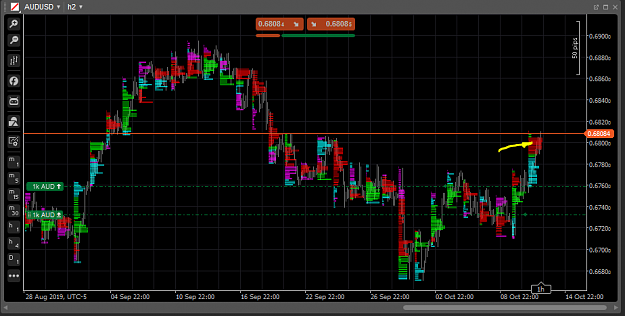
I have been using futures charts volume (taken from CME) on tradingview up until now.