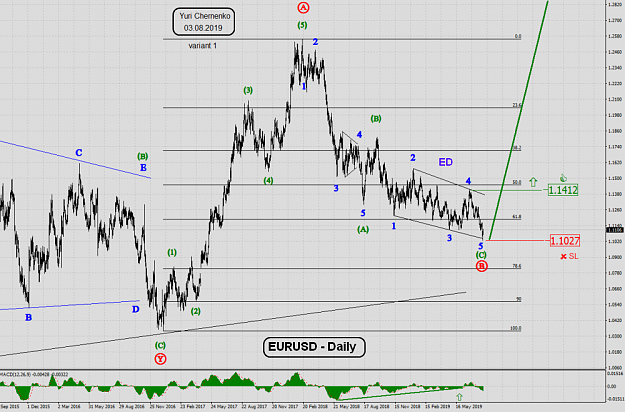
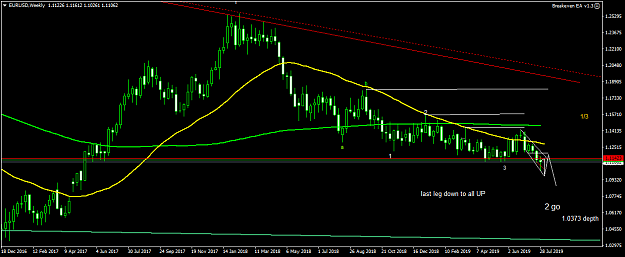
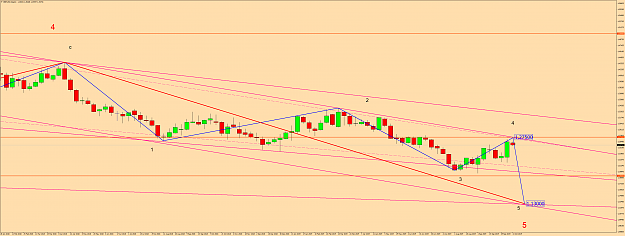
Here´s the original Day chart.
Note the High of the 18th of June.
Time, Price, Momentum and Pattern all are aligned for a short campaign.
Note the High of the 18th of June.
Time, Price, Momentum and Pattern all are aligned for a short campaign.
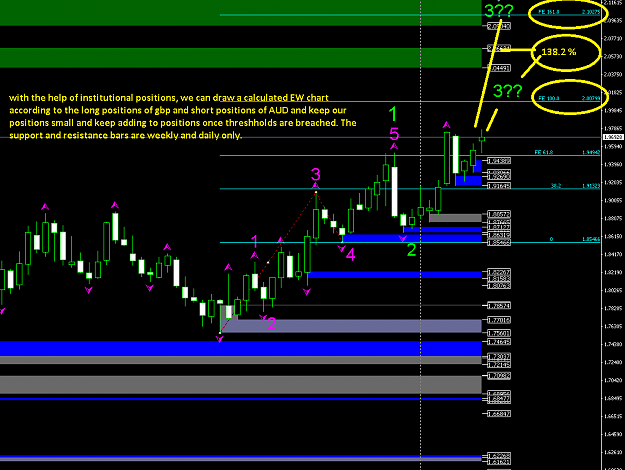
Attached Image (click to enlarge)