Here's a common trap that the MM uses often. The MM runs the contraction phase for a longer period of time trying to trap more buyers. As soon as they have enough buyers they move the range out of the box to the north and these traders are now up 10+ pips and more buyers are coming into the market because they feel like they're losing out on this easy trade. So the MM runs it up to about 13 pips and the MM start to railroad track in a slightly down angle red candle then a green candle and the MM screw around like this for two hours trying to keep the buyers around then boom, the MM runs the pair up almost 60 pips and this draws even more buyers into the market, then the MM pushes the pair down 100 pips crushing the dreams of all of these poor buyers forcing them to close out of their trades or go into swap then they'll be up all night worrying about their trade they got into chasing 10 pips. Now that easy 10 pip trade has cost them, and maybe cost them they're whole account.
Yep, this happened to me several times. I was in a trade just like this trade but back then I was a 5-10 lot trader. If it looked like a really good buy trade I would buy at least 7-10 lots and sit there and be glued to my monitor hoping for the trade to keep going up. When I was confident on this one trade I walked to the bath room I was up +$312.00, I have a fairly good size home so I was gone a couple of minutes. When I came back into my office I was down -$240.00 and it was dropping quickly. I said to myself what the hell just happened and back then I didn't know what I know now. I ended up closing the trade down a little over $500 and a little over 2 hours later if I would have stayed in the trade I would have made a nice profit.
This is the way this business is, the MM tricks you into buying when you should be selling. When you look at the monitor see the opposite, because the opposite is coming real soon.
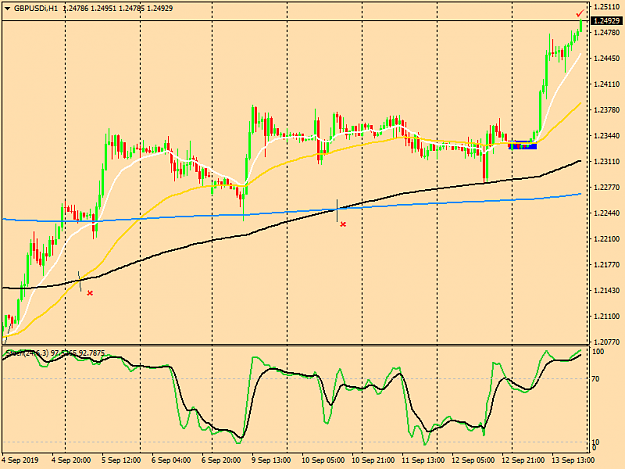
This the GBP/USD H1 chart. I tried to squeeze in the whole chart and I didn't succeed. Anyway, if you look at the left bottom corner you can see a small black line the runs through the 13MA crossing the 50MA, there is also a red x there but it wasn't saved. This is beginning the 1st level of this week. The 2nd level of the week has a line through the 50MA crossing the 200MA and you can see the 2nd x in the photo. The beginning of the 3rd level is mark by a line running through and the 3rd red x with the 200MA crossing the 800 MA. And if you look at the upper right of the chart you see a red check mark. This signals the end of the 3 level cycle. The reason that I'm showing you this is so you can incorporate the cycles that I talk about with this levels.
As for future of the GBP/USD I look for the pair to start dropping next week. The reason I say this is because this pair has run it's course basically side ways from Sunday -Thursday, it ran up today so the MM can take some profits off the table. In 9 days this pair went up over 518 pips.
Every pair has 3 levels just like this pair. The reason I used this pair is because this was the first pair that I found showing the 3 levels.
If you use the 13MA,50MA,200MA,800MA you can find these levels yourself. So after the 13MA crosses the 50MA this is the beginning of the 1st level, and when the 50MA crosses the 200MA is the beginning of the 2nd level. And when the 200MA crosses the 800MA this is the beginning of the 3rd level. Usually traders will buy or sell with the beginning of the 3rd level. Because they are confident with the direction of the pair.
If you use these levels with the daily cycle you should know where your at in trading most of the time. The 13MA,50MA,200MA,800MA works well on the 1 hour chart.
These levels work going up and going down. These levels will help you stay in trades longer if you aren't over leveraged. You should always know where you are at when you are a buyer or a seller.
Hi PokeChip, thank for your sharing and explanation of the 3 level cycles. For the 800MA, are your setting exponential, close ? Tried to set EMA 800 but is different from your chart. There was a fake out on 2019/09/12 that touched MA200, can this use it as a reversal signal to long GBPUSD?
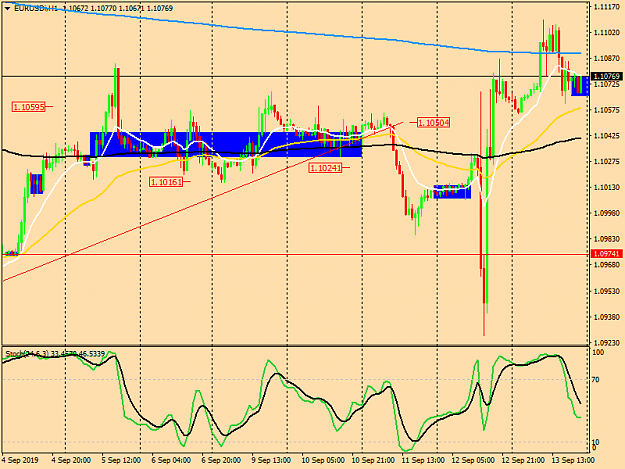
Take a look at the middle blue box. " Most of the time " when there is a exit out of the box on a 1 hour chart " that is a fake move ", there will be 3 candles up or down. Some times only 2 candles. If there is only one candle, that candle will be a longer candle. After these fake moves the MM will make the move to the other direction.
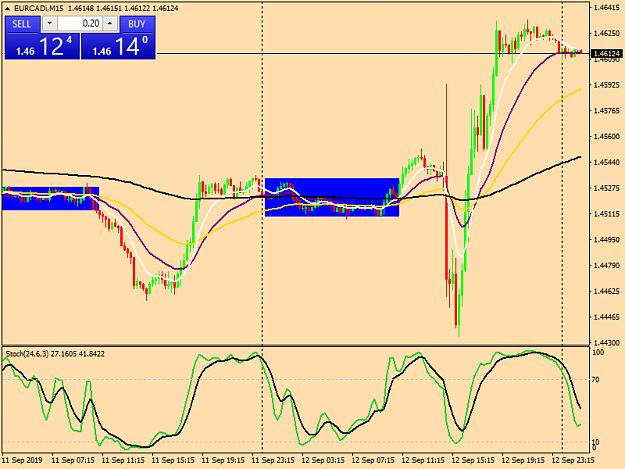
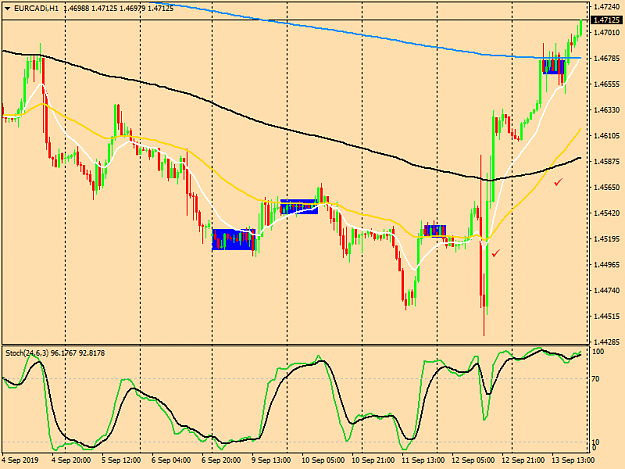
Here is a chart of the EUR/CAD. Next week I look for the pair to keep moving up for two reasons. Look at the chart and you'll see 2 check marks, The bottom check mark is the 13MA crossing the 50MA, this is the beginning of the 1st level. The next check mark above is the beginning of the 2nd level with the 50MA crossing the 200MA. I look for the 200MA to eventually cross the 800MA which will be the beginning of the 3rd level.
This the GBP/USD H1 chart. I tried to squeeze in the whole chart and I didn't succeed. Anyway, if you look at the left bottom corner you can see a small black line the runs through the 13MA crossing the 50MA, there is also a red x there but it wasn't saved. This is beginning the 1st level of this week. The 2nd level of the week has a line through the 50MA crossing the 200MA and you can see the 2nd x in the photo. The beginning of the 3rd level is mark by a line running through and the 3rd red x with the 200MA crossing the 800 MA. And if you look...
Ignored
Great explanation Pokerchip, I am beginning to understand the system. Many thanks for your time and efforts.
regards,
Peter
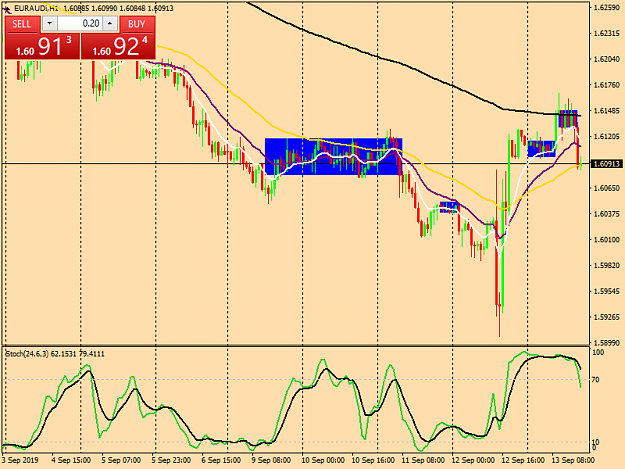
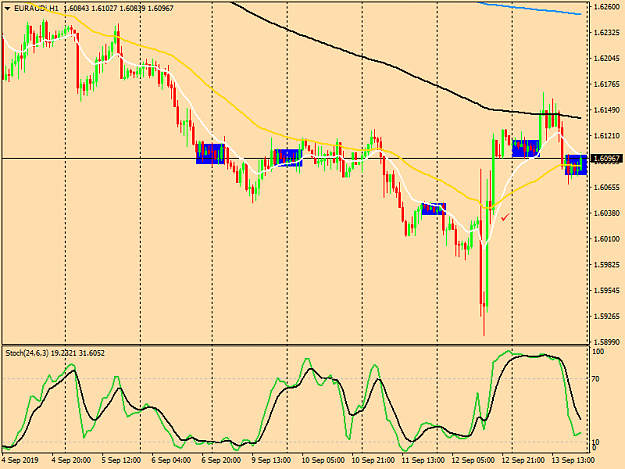
Here's a look at the EUR/AUD 1 hour chart. You can see the 13MA crossing the 50MA where the check mark is located. I look for this pair to keep on moving up until the 50MA crosses the 200MA.
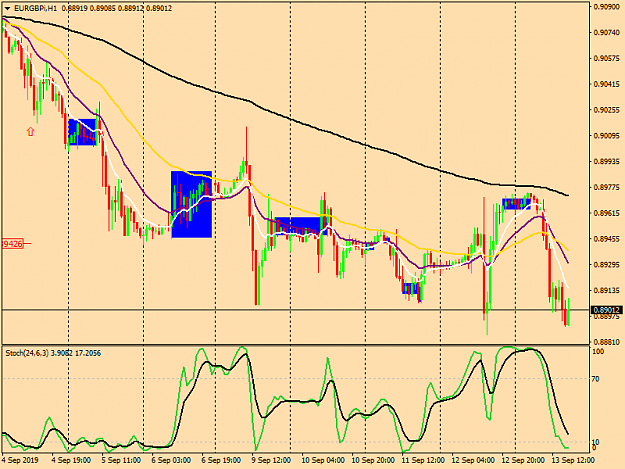
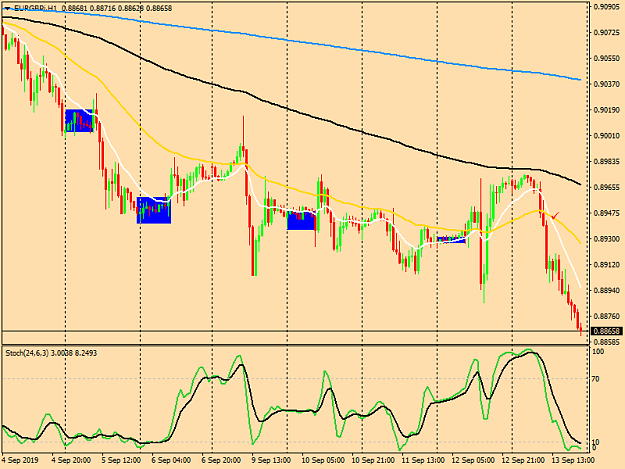
Here's a chart of the EUR/GBP 1 hour chart. Looking at the check mark where the 13MA crosses under the 50MA I look for this pair to keep moving lower until the 50MA crosses under the 200MA.
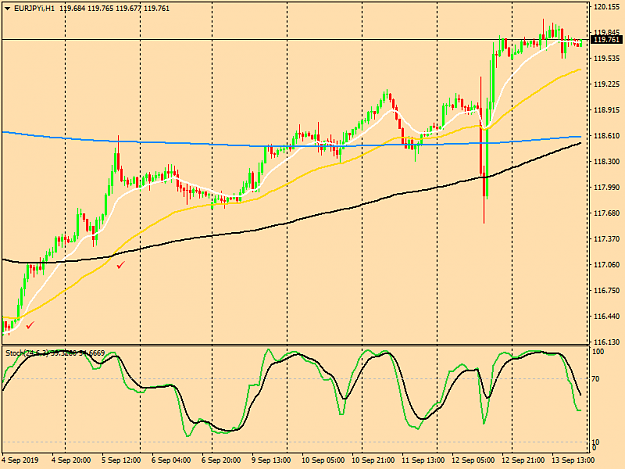
Here's the chart of the EUR/JPY 1 hour. I look for this pair to keep on moving up since the 13MA has crossed the 50MA and the 50MA has already crossed the 200MA, and you can see on the chart that the 200MA is very close to crossing over the 800MA which will put the pair at the beginning of the 3rd level.
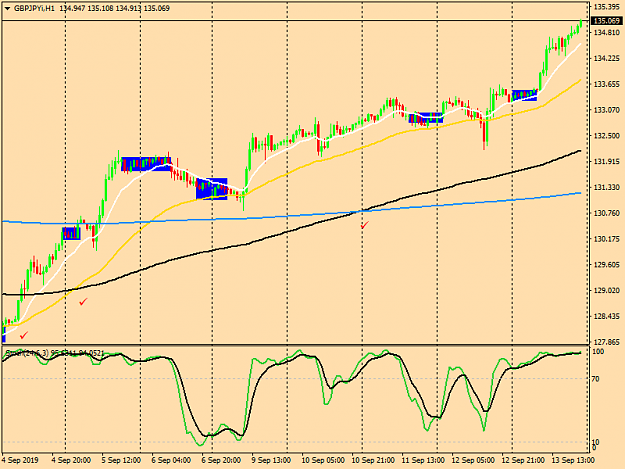
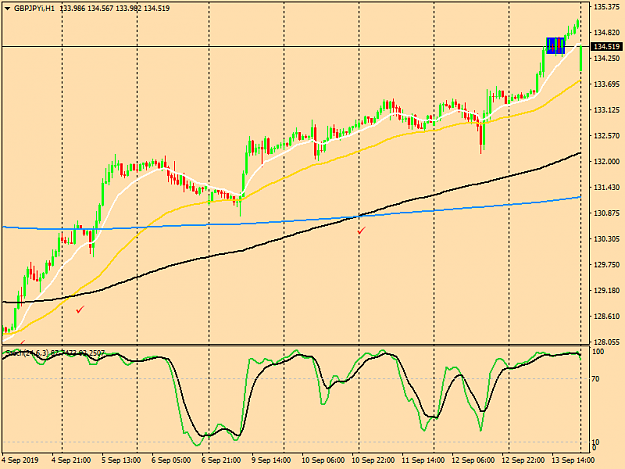
The 1 hour chart of the GBP/JPY show's a older or mature 3rd level. This pair is up 680 pips since September 4th. I look for the pair to start dropping very soon.
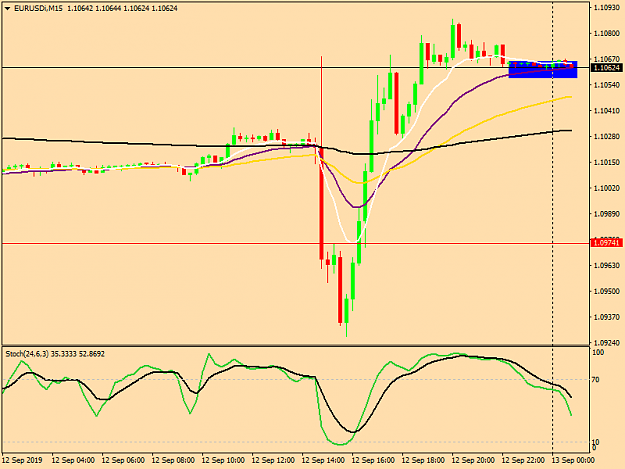
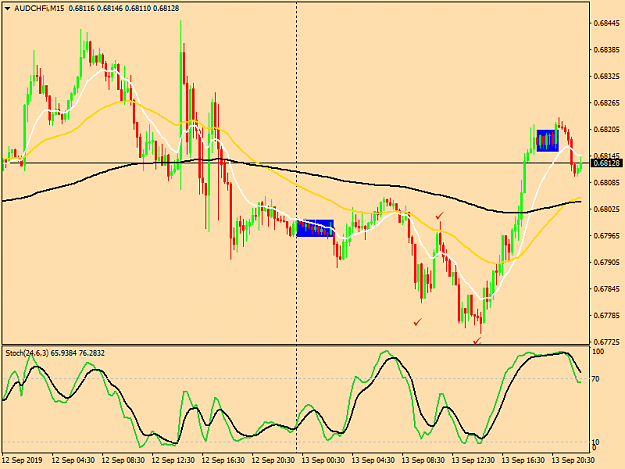
Take a good look at this pair AUD/CHF on the 15 minute chart. This is one of they're favorites, " Possibly The Favorite Chart Pattern " that the market manipulators use against you. They use this chart pattern in every pair. I recommend taking a photo of it and putting it on your monitor. This chart has blown up hundreds of thousands accounts.
And that's why they still use this same pattern today.
It comes out of the box and fakes 3 red candles to the south and makes a move to the north for 3 hours, then moves back south for 8 hours, then back to the north for 4 hours. They will use this chart pattern several times a month. Three moves south and three moves north.
They also have another pattern that they use that is just the opposite of this chart pattern. I will find it and post it on here.
Here's a chart of the EUR/GBP 1 hour chart. Looking at the check mark where the 13MA crosses under the 50MA I look for this pair to keep moving lower until the 50MA crosses under the 200MA. {image}
Ignored
For this case, MA50 is already below MA200, and if this pair keep moving lower, MA50 will never cross under MA200, unless MA200 is now below MA50.
{quote} For this case, MA50 is already below MA200, and if this pair keep moving lower, MA50 will never cross under MA200, unless MA200 is now below MA50.
Ignored
I would wait for conformation. Let the pair run, and if continues going up wait for the 200MA to cross the 800MA which will be the 3rd stage, the best stage if you ask me.
The 1 hour chart of the GBP/JPY show's a older or mature 3rd level. This pair is up 680 pips since September 4th. I look for the pair to start dropping very soon. {image}
Ignored
Do you wait until MA13 crosses below MA50 then short ?
{quote} Do you wait until MA13 crosses below MA50 then short ?
Ignored
(This is the pair I'm talking about GBP/JPY) ( This same thing goes for GBP/USD)
Yep, I would wait for 13MA to cross under the 50MA. That right there will give you the conformation that you need. Then the 2nd level is for the 50MA to cross under the 200MA, the next level is the 3rd level which is the 200MA to cross under the 800MA. The 3rd level is the most explosive level of all levels ( when going up or when it goes down). You could see a 200-300 or more pip drop on the 3rd level.
Note: When trading opened today this pair dropped a little over 107 pips. The " MM " pushing this pair up in a hurry trying to draw buyers into this pair, this is a suckers bet. Don't buy this pair, were on the down slide and the beginning of the 1st level of a slippery slope.
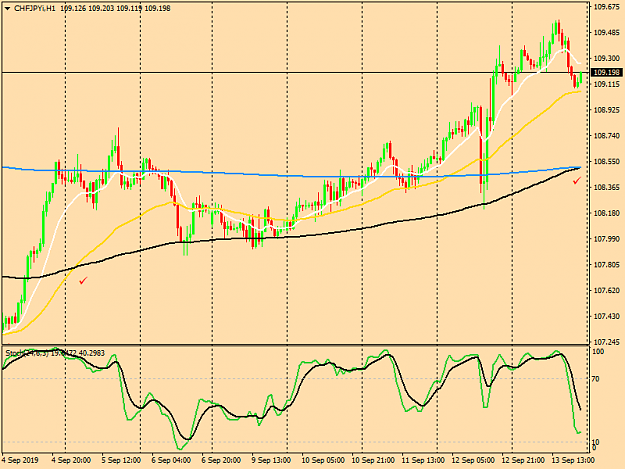
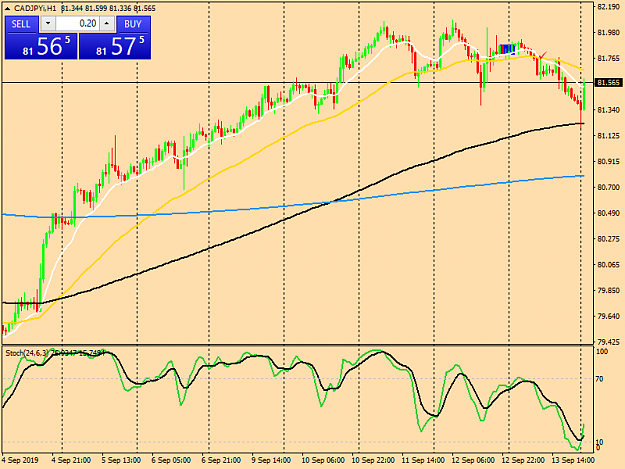
This pair CAD/JPY is in the 1st stage level of a "DOWN" cycle. You can see the red check mark of the 13MA crossing under the 50MA. Next 2nd level will be the 50MA crossing under the 200MA. The 3rd and last level is where you can make a lot of pips.