Disliked{quote} I understand that point. I like analyzing strength/weakness to stay focused on the price action. But sometimes I wonder if it's actually useful. In many (or all) cases we can interpret the PA in two opposite ways, and they can both be right. Examples:Small candles means more balanced buying/selling, but we don't KNOW who is actually stronger at that moment
Ignored
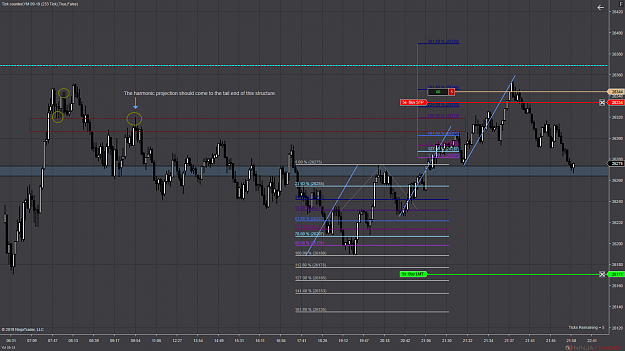
1. Why is price moving to that particular area of structure?
2. Why did it stop there? (look left)
3. Is there anyway I can find where price will be stopped in advanced based on 1 and 2?
4. When I look at the clusters of structure to the left, which structural areas can I mentally combine to find the average combined strength that would stop price in its tracks combined with harmonics?
5. Within these clustered areas of structure to the left (while using my data tool), are there any price levels that stopped at the exact price that I can use for candlestick confluence. (by the way, candlestick confluence is just something that I just coined right now. I don't really know what to call it. ha ha )
Anyways, I don't know if this helps anyone out, but these are some of the questions that run through my mind as I am analyzing price action to the left of current price.
Luck has no place in trading. Leave that for the poker table.
1