{quote} what is the significance of this pivot and actually why is it a pivot please?
Ignored
The significance is that it is the pivot under attack and was not in divergence. Had the price passed this level then it would have run into divergence (Dashed red line)
{quote} what is the significance of this pivot and actually why is it a pivot please?
Ignored
As to why it was a pivot, well that can easily be seen on my chart because the line chart says it was. A 1 period SMA is exactly the same as a line chart.
See how much harder it is to see these things with candle charts and no SMA
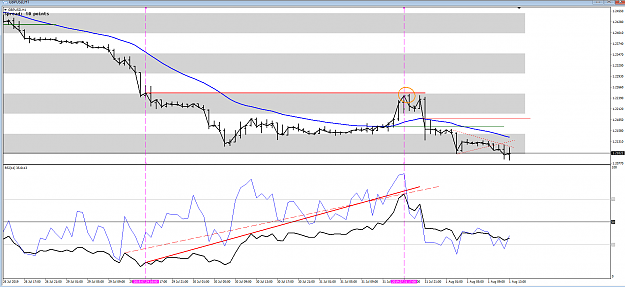
{quote} The significance is that it is the pivot under attack and was not in divergence. Had the price passed this level then it would have run into divergence (Dashed red line) {image}
Ignored
That is why I went for the dashed line on the RSI as there was no clear line of sight with the corresponding previous price pivot.
{quote} As to why it was a pivot, well that can easily be seen on my chart because the line chart says it was. A 1 period SMA is exactly the same as a line chart. See how much harder it is to see these things with candle charts and no SMA
Ignored
Hi Alan
I am sorry for being too stupid to understand this, hopefully i can ask for further clarification.
I would actually look at the 4 bar before your pivot, reason being is the RSI made a peak, and on the price chart, it does look like it is trying to make a high, so I would just draw the ABCD using this information.
And what do you mean by "A 1 period SMA is exactly the same as a line chart", do you mean the close of this candle is the same point as the SMA line? but isnt it a fact because the SMA has only 1 period and calculate using close price?
{quote} Hi Alan I am sorry for being too stupid to understand this, hopefully i can ask for further clarification. I would actually look at the 4 bar before your pivot, reason being is the RSI made a peak, and on the price chart, it does look like it is trying to make a high, so I would just draw the ABCD using this information. And what do you mean by "A 1 period SMA is exactly the same as a line chart", do you mean the close of this candle is the same point as the SMA line? but isnt it a fact because the SMA has only 1 period and calculate using...
Ignored
Luckyvictor, point A is always the next pivot being "attacked", as Alan would say, or approached by point C.
Point C can be a pivot in the 1SMA, or it can simply be a bar close.
The 1SMA is used to clearly show the pivots in price, like a line chart.
I highly recommend you read the PDFs available in the attachments for this thread.
{quote} Luckyvictor, point A is always the next pivot being "attacked", as Alan would say, or approached by point C. Point C can be a pivot in the 1SMA, or it can simply be a bar close. The 1SMA is used to clearly show the pivots in price, like a line chart. I highly recommend you read the PDFs available in the attachments for this thread. Cheers
Ignored
I read through it twice already, but from time to time, I may confuse myself from practical experience or simply forget things, or simply not understanding it correctly.
So to work out point A, we first identify point C, and going back to check the closest price pivot, and claim this one the pivot being attacked, is it correct?
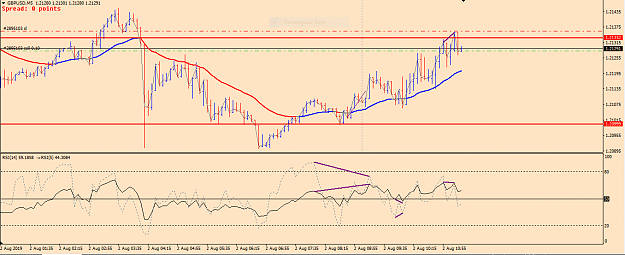
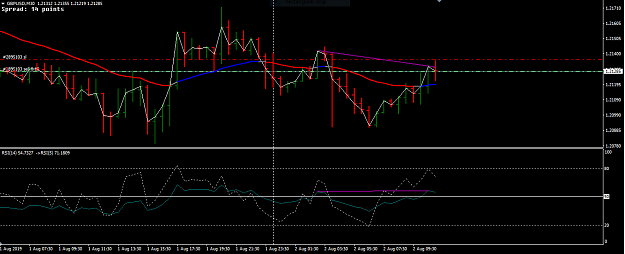
Hi guys! Anyone looking at this short signal? Correct me if I'm wrong please. {image} {image}
Ignored
I did take that short entry but unfortunately I was only able to take 2 positions and missed the 3rd one because I had to leave my laptop just for few minutes.
{quote} Sorry for the late reply, I am a tad busy with other stuff for the next few weeks. Not much time for any trading other than a few quick scalps.
Ignored
have a nice time with whatever you are doing and thanks for your great system
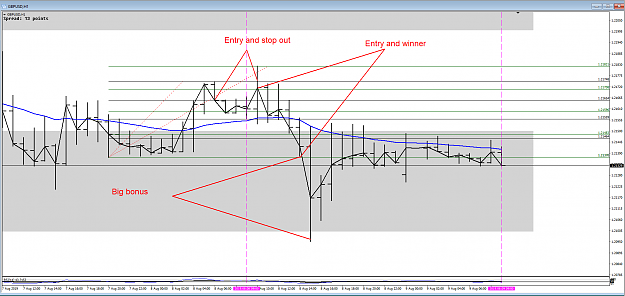
So Simon how did you go with that quartile trade yesterday. The first one would have stopped you out and depending whether you moved the stop at all would have been a loser, This was then followed by the winner. Cool uh!
Noting how it dragged the average past the previous swing high.
This was a 3:1 Trade less the loser = 2:1 i.e. 10% winnings
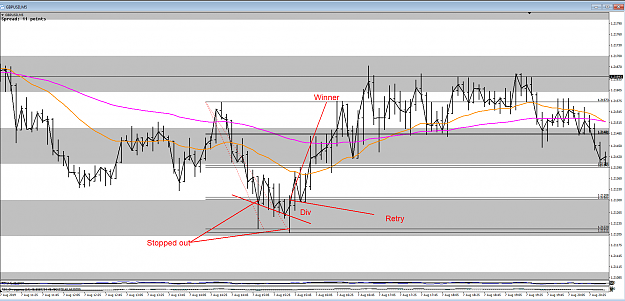
So Simon how did you go with that quartile trade yesterday. The first one would have stopped you out and depending on whether you moved the stop at all would have been a loser, This was then followed by the winner. Cool uh! Noting how it dragged the average past the previous swing high. This was a 3:1 Trade less the loser = 2:1 i.e. 10% winnings {image}
Ignored
I didn't take any trades yesterday, but I will for sure try to catch some today. We'll see how it goes. Wish me luck.
Just curious... Has anyone come across a helpful RSI divergence indicator that gives signals according to bar closes (not highs/lows)? Even better would be one which also showed divergences between the fast and slow RSIs. Cheers
Ignored
I had one a while back but lost it when I had a PC crash.
It would show not only the continuation divs but also put the target on the price chart.
So if I had one once it must be possible to make a new one.
{quote} I had one a while back but lost it when I had a PC crash. It would show not only the continuation divs but also put the target on the price chart. So if I had one once it must be possible to make a new one.
Ignored
Alan, was it custom made like your hidden divergence indicator (which is brilliant), or did you simply find it somewhere on the internet?
All of the divergence indicators I've seen connect bar highs/lows and not the closes. I've also never seen one plot divergences between fast and slow RSIs.
I may have a rather silly question, but hopefully people can all share how they see and think.
With the GBPUSD being so bearish, how do you trade? How do you evaluate the signal?
When a bearish signal come, how far can it still travel?
When a bullish signal come, how strong or real can it be?
I know the answer may well be in the technical analysis from the graph itself, but looking at the global picture, looks like it is way too low that a (dead cat) bounce may occur anytime
{quote} Alan, was it custom made like your hidden divergence indicator (which is brilliant), or did you simply find it somewhere on the internet? All of the divergence indicators I've seen connect bar highs/lows and not the closes. I've also never seen one plot divergences between fast and slow RSIs. It would be an awesome tool if it did exist! Cheers
Ignored
If you can accurately describe what it is that you want you can get it made by posting a job on MQL5 in the Freelance section. It will cost you anywhere from $30.00 USD and above depending how complex the code is.