• Home
  • Forums
  • Trades
  • News
  • Calendar
  • Market
  • Brokers
  • Login
  • Join
  • User/Email: Password:
  • 11:56pm
Menu
  • Forums
  • Trades
  • News
  • Calendar
  • Market
  • Brokers
  • Login
  • Join
  • 11:56pm
Sister Sites
  • Metals Mine
  • Energy EXCH
  • Crypto Craft

Options

Bookmark Thread

First Page First Unread Last Page Last Post

Print Thread

Similar Threads

Trading With Moving Averages 72 replies

Identifying Market Swings - Medium and Long Term Trading 618 replies

Moving Averages Zone Trading 10 replies

HELP! GMMA (Guppy's Multi-Moving Averages) Trading Mehod 3 replies

Via indicator: trading xxxyyy via zzz 0 replies

  • Trading Systems
  • /
  • Reply to Thread
  • Subscribe
  • 2,787
Attachments: Trading the Cable swings via averages
Exit Attachments

Trading the Cable swings via averages

  • Last Post
  •  
  • 1 217218Page 219220221 345
  • 1 Page 219 345
  •  
  • Post #4,361
  • Quote
  • Aug 1, 2019 6:59am Aug 1, 2019 6:59am
  •  Nala66
  • Joined Mar 2016 | Status: Member | 4,467 Posts | Invisible
Quoting luckyvictor
Disliked
{quote} what is the significance of this pivot and actually why is it a pivot please?
Ignored
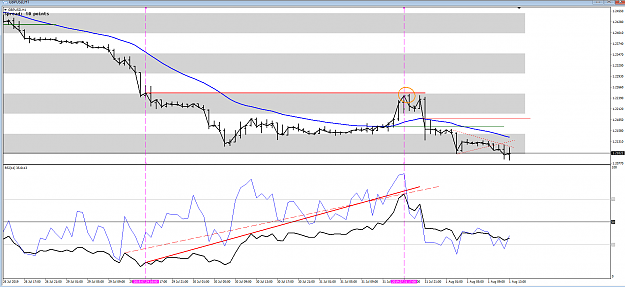
The significance is that it is the pivot under attack and was not in divergence. Had the price passed this level then it would have run into divergence (Dashed red line)
Attached Image (click to enlarge)
Click to Enlarge

Name: Screenshot1.png
Size: 47 KB
  • Post #4,362
  • Quote
  • Aug 1, 2019 7:01am Aug 1, 2019 7:01am
  •  Nala66
  • Joined Mar 2016 | Status: Member | 4,467 Posts | Invisible
Quoting luckyvictor
Disliked
{quote} what is the significance of this pivot and actually why is it a pivot please?
Ignored
As to why it was a pivot, well that can easily be seen on my chart because the line chart says it was. A 1 period SMA is exactly the same as a line chart.

See how much harder it is to see these things with candle charts and no SMA
  • Post #4,363
  • Quote
  • Aug 1, 2019 7:36am Aug 1, 2019 7:36am
  •  mayflower
  • | Joined Nov 2018 | Status: Member | 84 Posts
Quoting Nala66
Disliked
{quote} The significance is that it is the pivot under attack and was not in divergence. Had the price passed this level then it would have run into divergence (Dashed red line) {image}
Ignored
That is why I went for the dashed line on the RSI as there was no clear line of sight with the corresponding previous price pivot.
  • Post #4,364
  • Quote
  • Aug 1, 2019 8:50am Aug 1, 2019 8:50am
  •  luckyvictor
  • | Joined Jul 2017 | Status: Member | 250 Posts
Quoting Nala66
Disliked
{quote} As to why it was a pivot, well that can easily be seen on my chart because the line chart says it was. A 1 period SMA is exactly the same as a line chart. See how much harder it is to see these things with candle charts and no SMA
Ignored
Hi Alan

I am sorry for being too stupid to understand this, hopefully i can ask for further clarification.

I would actually look at the 4 bar before your pivot, reason being is the RSI made a peak, and on the price chart, it does look like it is trying to make a high, so I would just draw the ABCD using this information.

And what do you mean by "A 1 period SMA is exactly the same as a line chart", do you mean the close of this candle is the same point as the SMA line? but isnt it a fact because the SMA has only 1 period and calculate using close price?
  • Post #4,365
  • Quote
  • Aug 1, 2019 5:26pm Aug 1, 2019 5:26pm
  •  haris1211
  • | Joined Nov 2018 | Status: Member | 48 Posts
Hye Alan,
Can you please post your trades for today and thought process behind them so we could learn from them.
Thanks.
  • Post #4,366
  • Quote
  • Edited at 9:23pm Aug 1, 2019 7:22pm | Edited at 9:23pm
  •  k1w1
  • | Joined Jun 2019 | Status: Member | 67 Posts
Quoting luckyvictor
Disliked
{quote} Hi Alan I am sorry for being too stupid to understand this, hopefully i can ask for further clarification. I would actually look at the 4 bar before your pivot, reason being is the RSI made a peak, and on the price chart, it does look like it is trying to make a high, so I would just draw the ABCD using this information. And what do you mean by "A 1 period SMA is exactly the same as a line chart", do you mean the close of this candle is the same point as the SMA line? but isnt it a fact because the SMA has only 1 period and calculate using...
Ignored
Luckyvictor, point A is always the next pivot being "attacked", as Alan would say, or approached by point C.

Point C can be a pivot in the 1SMA, or it can simply be a bar close.

The 1SMA is used to clearly show the pivots in price, like a line chart.

I highly recommend you read the PDFs available in the attachments for this thread.

Cheers
  • Post #4,367
  • Quote
  • Aug 2, 2019 3:48am Aug 2, 2019 3:48am
  •  luckyvictor
  • | Joined Jul 2017 | Status: Member | 250 Posts
Quoting k1w1
Disliked
{quote} Luckyvictor, point A is always the next pivot being "attacked", as Alan would say, or approached by point C. Point C can be a pivot in the 1SMA, or it can simply be a bar close. The 1SMA is used to clearly show the pivots in price, like a line chart. I highly recommend you read the PDFs available in the attachments for this thread. Cheers
Ignored
I read through it twice already, but from time to time, I may confuse myself from practical experience or simply forget things, or simply not understanding it correctly.

So to work out point A, we first identify point C, and going back to check the closest price pivot, and claim this one the pivot being attacked, is it correct?
  • Post #4,368
  • Quote
  • Aug 2, 2019 4:24am Aug 2, 2019 4:24am
  •  Djinerro
  • | Joined Jun 2019 | Status: Junior Member | 4 Posts
Hi guys!

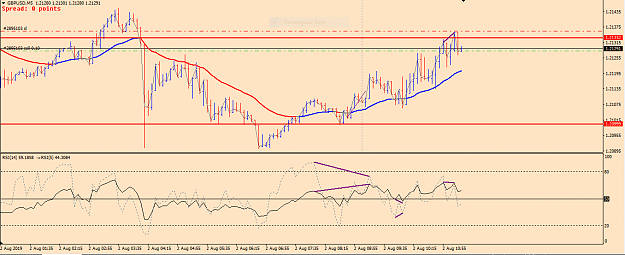
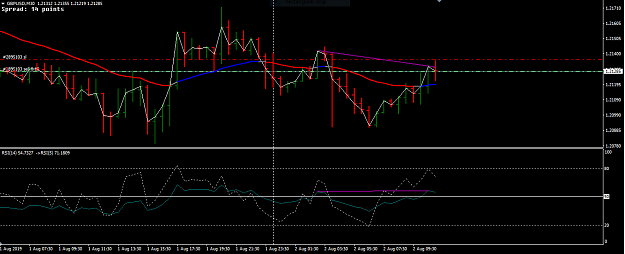
Anyone looking at this short signal? Correct me if I'm wrong please.
Attached Images (click to enlarge)
Click to Enlarge

Name: gbpusdM5.PNG
Size: 36 KB Click to Enlarge

Name: gbpusdM30.PNG
Size: 34 KB
  • Post #4,369
  • Quote
  • Aug 2, 2019 6:21am Aug 2, 2019 6:21am
  •  haris1211
  • | Joined Nov 2018 | Status: Member | 48 Posts
Quoting Djinerro
Disliked
Hi guys! Anyone looking at this short signal? Correct me if I'm wrong please. {image} {image}
Ignored
I did take that short entry but unfortunately I was only able to take 2 positions and missed the 3rd one because I had to leave my laptop just for few minutes.
  • Post #4,370
  • Quote
  • Aug 6, 2019 6:22am Aug 6, 2019 6:22am
  •  Nala66
  • Joined Mar 2016 | Status: Member | 4,467 Posts | Invisible
Quoting haris1211
Disliked
Hye Alan, Can you please post your trades for today and thought process behind them so we could learn from them. Thanks.
Ignored
Sorry for the late reply, I am a tad busy with other stuff for the next few weeks. Not much time for any trading other than a few quick scalps.
  • Post #4,371
  • Quote
  • Aug 7, 2019 2:35am Aug 7, 2019 2:35am
  •  huskyboy
  • | Joined Sep 2009 | Status: Member | 1,266 Posts
Quoting Nala66
Disliked
{quote} Sorry for the late reply, I am a tad busy with other stuff for the next few weeks. Not much time for any trading other than a few quick scalps.
Ignored
have a nice time with whatever you are doing and thanks for your great system
don't follow me
  • Post #4,372
  • Quote
  • Aug 8, 2019 12:24am Aug 8, 2019 12:24am
  •  Nala66
  • Joined Mar 2016 | Status: Member | 4,467 Posts | Invisible
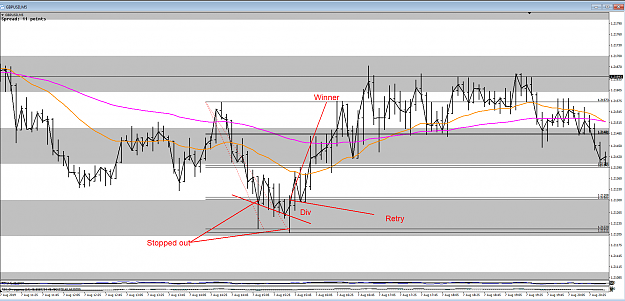
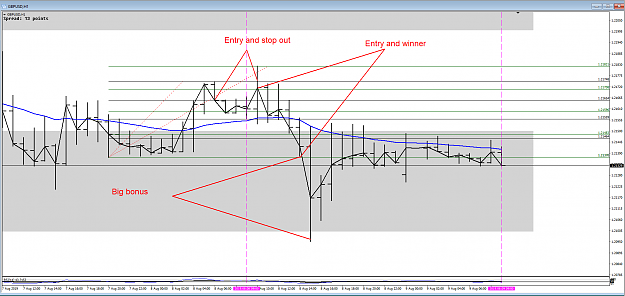
So Simon how did you go with that quartile trade yesterday. The first one would have stopped you out and depending whether you moved the stop at all would have been a loser, This was then followed by the winner. Cool uh!

Noting how it dragged the average past the previous swing high.

This was a 3:1 Trade less the loser = 2:1 i.e. 10% winnings
Attached Image (click to enlarge)
Click to Enlarge

Name: Screenshot1.png
Size: 64 KB
1
  • Post #4,373
  • Quote
  • Aug 8, 2019 6:48pm Aug 8, 2019 6:48pm
  •  k1w1
  • | Joined Jun 2019 | Status: Member | 67 Posts
Just curious...

Has anyone come across a helpful RSI divergence indicator that gives signals according to bar closes (not highs/lows)?

Even better would be one which also showed divergences between the fast and slow RSIs.

Cheers
  • Post #4,374
  • Quote
  • Aug 9, 2019 1:52am Aug 9, 2019 1:52am
  •  simon.says
  • | Joined Nov 2018 | Status: Member | 40 Posts
Quoting Nala66
Disliked
So Simon how did you go with that quartile trade yesterday. The first one would have stopped you out and depending on whether you moved the stop at all would have been a loser, This was then followed by the winner. Cool uh! Noting how it dragged the average past the previous swing high. This was a 3:1 Trade less the loser = 2:1 i.e. 10% winnings {image}
Ignored
I didn't take any trades yesterday, but I will for sure try to catch some today. We'll see how it goes. Wish me luck.
  • Post #4,375
  • Quote
  • Aug 9, 2019 2:42am Aug 9, 2019 2:42am
  •  Nala66
  • Joined Mar 2016 | Status: Member | 4,467 Posts | Invisible
Quoting k1w1
Disliked
Just curious... Has anyone come across a helpful RSI divergence indicator that gives signals according to bar closes (not highs/lows)? Even better would be one which also showed divergences between the fast and slow RSIs. Cheers
Ignored
I had one a while back but lost it when I had a PC crash.

It would show not only the continuation divs but also put the target on the price chart.

So if I had one once it must be possible to make a new one.
  • Post #4,376
  • Quote
  • Aug 9, 2019 2:49am Aug 9, 2019 2:49am
  •  Nala66
  • Joined Mar 2016 | Status: Member | 4,467 Posts | Invisible
Quoting simon.says
Disliked
{quote} I didn't take any trades yesterday, but I will for sure try to catch some today. We'll see how it goes. Wish me luck.
Ignored
Here is another example on the 1 hour... Again the first attempt failed but the second was massive.
Attached Image (click to enlarge)
Click to Enlarge

Name: Screenshot1.png
Size: 53 KB
  • Post #4,377
  • Quote
  • Aug 9, 2019 8:17am Aug 9, 2019 8:17am
  •  haris1211
  • | Joined Nov 2018 | Status: Member | 48 Posts
Hye Alan,
I just sent you a PM i hope you'll find time to respond to that.
Thanks
  • Post #4,378
  • Quote
  • Aug 11, 2019 6:38pm Aug 11, 2019 6:38pm
  •  k1w1
  • | Joined Jun 2019 | Status: Member | 67 Posts
Quoting Nala66
Disliked
{quote} I had one a while back but lost it when I had a PC crash. It would show not only the continuation divs but also put the target on the price chart. So if I had one once it must be possible to make a new one.
Ignored
Alan, was it custom made like your hidden divergence indicator (which is brilliant), or did you simply find it somewhere on the internet?

All of the divergence indicators I've seen connect bar highs/lows and not the closes. I've also never seen one plot divergences between fast and slow RSIs.

It would be an awesome tool if it did exist!

Cheers
  • Post #4,379
  • Quote
  • Aug 11, 2019 7:41pm Aug 11, 2019 7:41pm
  •  luckyvictor
  • | Joined Jul 2017 | Status: Member | 250 Posts
I may have a rather silly question, but hopefully people can all share how they see and think.

With the GBPUSD being so bearish, how do you trade? How do you evaluate the signal?

When a bearish signal come, how far can it still travel?

When a bullish signal come, how strong or real can it be?

I know the answer may well be in the technical analysis from the graph itself, but looking at the global picture, looks like it is way too low that a (dead cat) bounce may occur anytime
  • Post #4,380
  • Quote
  • Aug 11, 2019 7:52pm Aug 11, 2019 7:52pm
  •  MrMagnet
  • | Joined Apr 2017 | Status: Member | 52 Posts
Quoting k1w1
Disliked
{quote} Alan, was it custom made like your hidden divergence indicator (which is brilliant), or did you simply find it somewhere on the internet? All of the divergence indicators I've seen connect bar highs/lows and not the closes. I've also never seen one plot divergences between fast and slow RSIs. It would be an awesome tool if it did exist! Cheers
Ignored
If you can accurately describe what it is that you want you can get it made by posting a job on MQL5 in the Freelance section. It will cost you anywhere from $30.00 USD and above depending how complex the code is.

https://www.mql5.com/en/job
  • Trading Systems
  • /
  • Trading the Cable swings via averages
  • Reply to Thread
    • 1 217218Page 219220221 345
    • 1 Page 219 345
1 member viewing:
jchome66
  • More
Top of Page
  • Facebook
  • Twitter
About FF
  • Mission
  • Products
  • User Guide
  • Media Kit
  • Blog
  • Contact
FF Products
  • Forums
  • Trades
  • Calendar
  • News
  • Market
  • Brokers
  • Trade Explorer
FF Website
  • Homepage
  • Search
  • Members
  • Report a Bug
Follow FF
  • Facebook
  • Twitter

FF Sister Sites:

  • Metals Mine
  • Energy EXCH
  • Crypto Craft

Forex Factory® is a brand of Fair Economy, Inc.

Terms of Service / ©2021