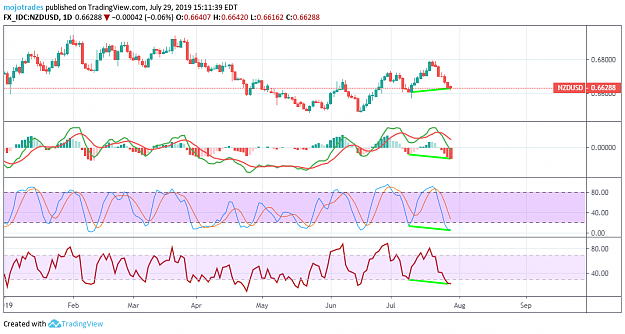
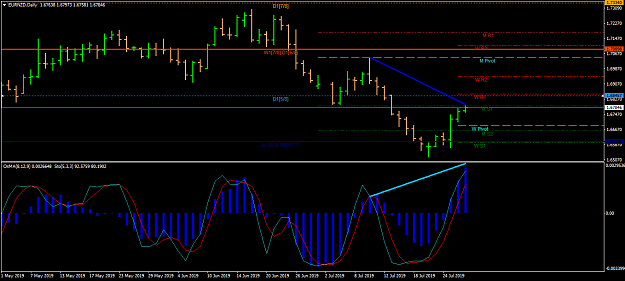
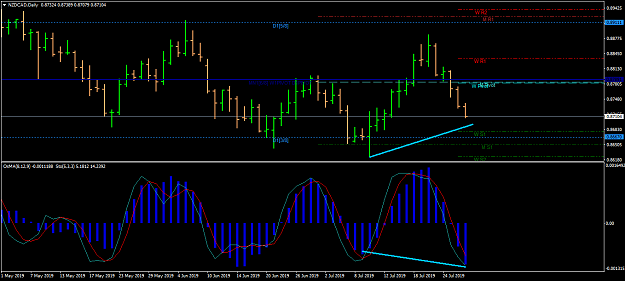
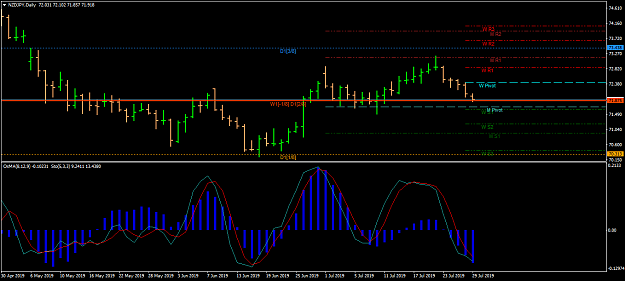
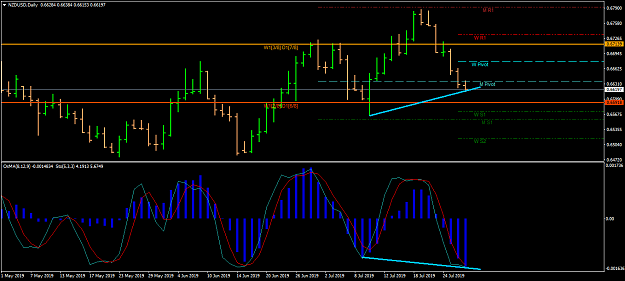
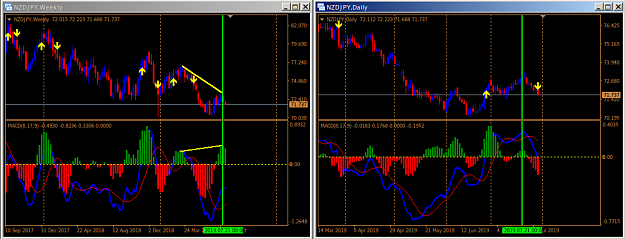
There are HD on daily charts: EN, NJ, NU,NC,EA.
Still have problem to post charts (funny thing ) May be something is wrong with my comp? How does it work, guys?
There are HD on daily charts: EN, NJ, NU,NC,EA. Still have problem to post charts (funny thing ) May be something is wrong with my comp? How does it work, guys?
Ignored
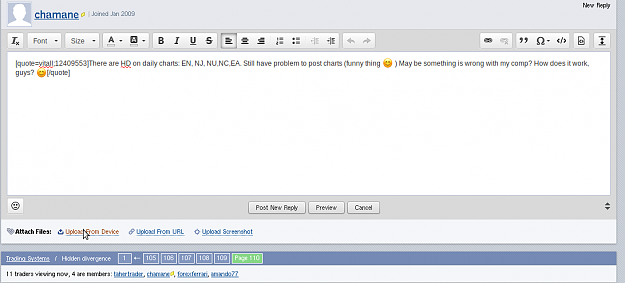
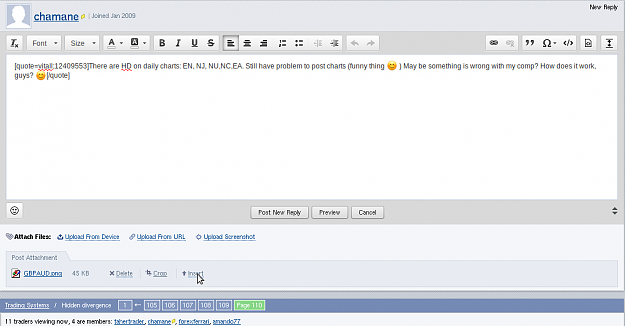
When writing your text, click on "Upload from Device" where you see "Attach Files".
{quote} When writing your text, click on "Upload from Device" where you see "Attach Files". {image} Then select your image file and click "Insert". {image}
{quote} When writing your text, click on "Upload from Device" where you see "Attach Files". {image} Then select your image file and click "Insert". {image}
Ignored
Helo, I’m following HD thread. I like this system but i have only a problem to determine the SL and TP. Can you please explain your method to get out of the trade timely?
{quote} Helo, I’m following HD thread. I like this system but i have only a problem to determine the SL and TP. Can you please explain your method to get out of the trade timely?
Ignored
Hi,
There are more than one way of doing it. You can use an ATR value or place your stop loss level at the last swing high/low, which I prefer. It is important that your risk is not more than 2-3% of your capital. If this is the case, you can trade on lower timeframes. For profit level, there are again more than one way. I use a RR = 1:1. I like to bring my stop loss to breakeven as soon as price reaches half my risk.
You can also trade with 2 units if the total risk is lower than 2% of your capital. You can close 1 unit when price reaches your risk in profit and let the other one roll.
{quote} Hi, There are more than one way of doing it. You can use an ATR value or place your stop loss level at the last swing high/low, which I prefer. It is important that your risk is not more than 2-3% of your capital. If this is the case, you can trade on lower timeframes. For profit level, there are again more than one way. I use a RR = 1:1. I like to bring my stop loss to breakeven as soon as price reaches half my risk. You can also trade with 2 units if the total risk is lower than 2% of your capital. You can close 1 unit when price reaches...
Ignored
I have used weekly pivots to spot areas of support and resistance to place SL & TP at next support or resistance level. But weekly pivots some times over complicate my trade because of the conflict in HD and pivots.
{quote} I have used weekly pivots to spot areas of support and resistance to place SL & TP at next support or resistance level. But weekly pivots some times over complicate my trade because of the conflict in HD and pivots.
Ignored
I don't use pivots so I cannot be of any help on that matter.
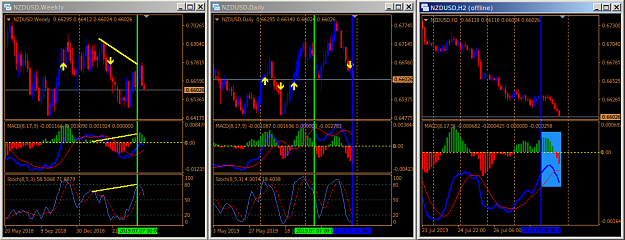
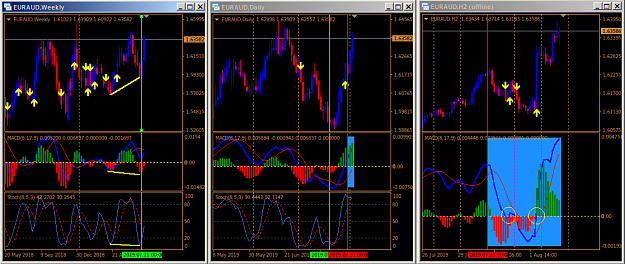
Hidden divergence spotted on the Weekly chart (red vertical line), trading zone started on the Daily (lime vertical line) and awaiting for entries on the 2 HR chart (blue rectangle).
Hidden divergence spotted on the Weekly chart (red vertical line), trading zone started on the Daily (lime vertical line) and awaiting for entries on the 2 HR chart (blue rectangle). {image}
Ignored
Hello chamane,
can you clear me the following?
how you find entry on 2HR chart? And how much extent you consider the trading zone ends now on Daily chart.
|
Additional Username
|
Joined Jul 2019
|577 Posts
I searched a lot to find good indicator that find divergence but most of them find every little moves on price that not followed by macd,is there any indicator that find divergence with higher changes in price and macd ?
{quote} Hello chamane, can you clear me the following? how you find entry on 2HR chart? And how much extent you consider the trading zone ends now on Daily chart.
Ignored
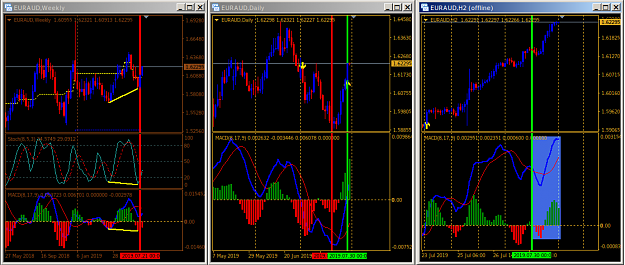
Hi,
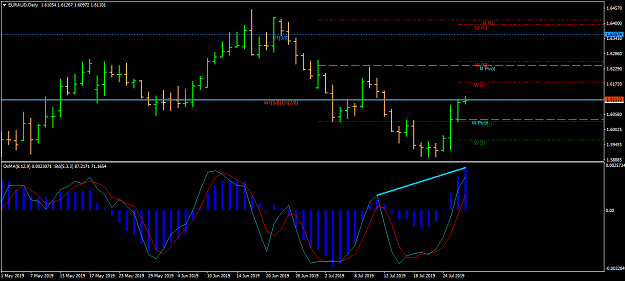
My entries on the 2HR chart are when MACD crosses the zero line. For instance, there were two entries on EURAUD, the first one (first circle) ended up with a small loss but the second one is showing a gain. In the trading zone, more often than not there should be an overall profit. The trading zone for me starts when MACD crosses the zero line on the intermediate chart and ends when it crosses back in the other direction.
I searched a lot to find good indicator that find divergence but most of them find every little moves on price that not followed by macd,is there any indicator that find divergence with higher changes in price and macd ?
Quite a difficult trading week for me. Considering though all the "heavy duty" News, Events, and general madness going on it was understandable I suppose.
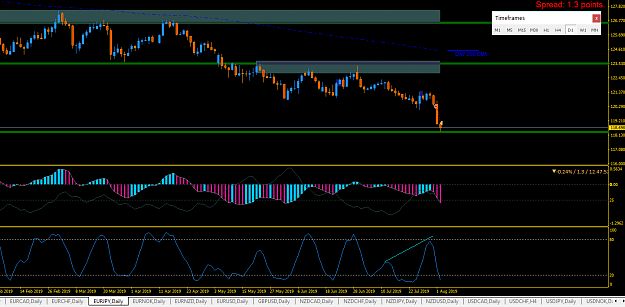
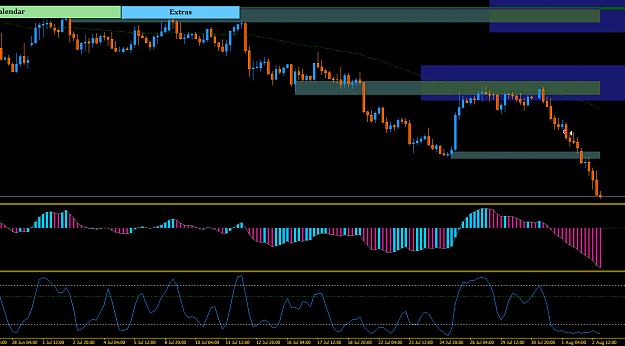
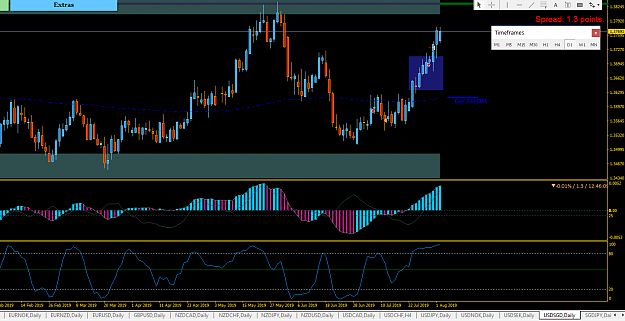
Results :- EUR/JPY +123, EUR/CHF BE, USD/SGD Loss -39
 ) May be something is wrong with my comp? How does it work, guys?