{quote} First thing is to differentiate between buy and sell volume per period. Then map this net volume to the total volume done so as to create unique price points. Sometimes the true price leads ordinary, at other times it lags but ordinary price is always attracted to the true price.
For NZDUSD, the true price as at the close of the last H1 candle is 0.65336 while ordinary price is 0.65357 I expect ordinary price to trade back below 0.65336 then re-test the EXACT level for the sell off to begin.
{quote} Weekly: 123.854 (current week's true price) Most recent support on weekly: 123.76 The true price suggest that there is still quite some upside to be done by this pair.
Ignored
Thanks again, I will watch with interest. I tend to trade shorter time frames but like to have a bigger picture view arrived at with a range of diverse analysis. I find it better to trade withe the bigger trend , even in smaller time frames. thanks again
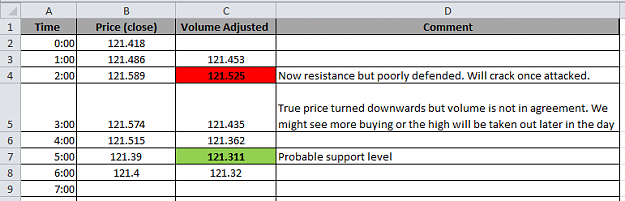
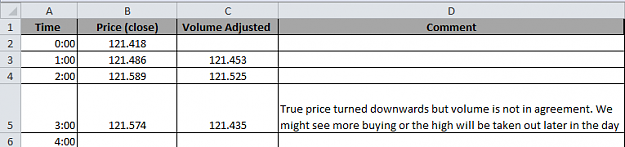
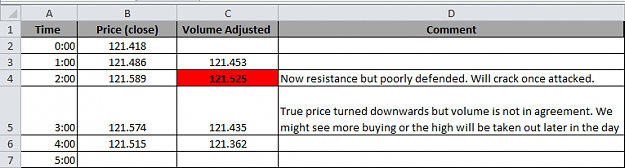
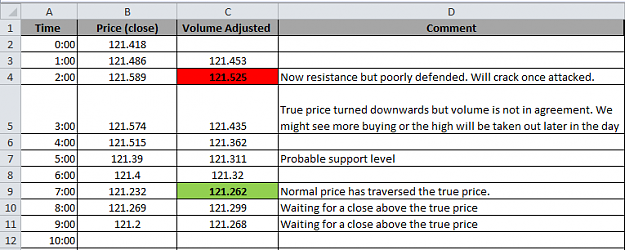
5th period, EURJPY H1 Notice that the true price has been lower than ordinary price thus far and is declining. Let's see whether ordinary price can become lower than true price (at this point, the intra-day support will form) and buyers will begin to step in. {image}
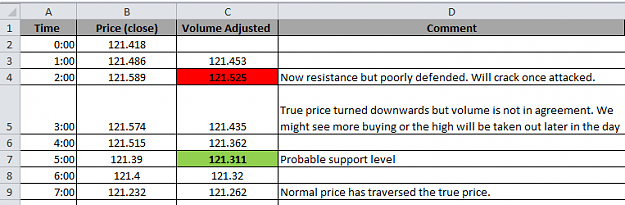
Once a H1 candle closes ABOVE 121.262 the buy has been confirmed. If it closes too far above 121.262 one can place a buy limit at 121.262 (make room for spread plus one pip) Your trade once executed will have the least possible draw down. Enjoy the trade!
Ignored
I sent you a PM based on your trading style but it's okay if you didnt feel like replying. Maybe I can still try to make some sense out of the little you have posted here.
A H1 candle close ABOVE its corresponding true price is what we await.
Note: This is the conservative entry. Once the condition above has been fulfilled, you can take the buy trade with peace of mind knowing that the support (volume adjusted) has got your back.