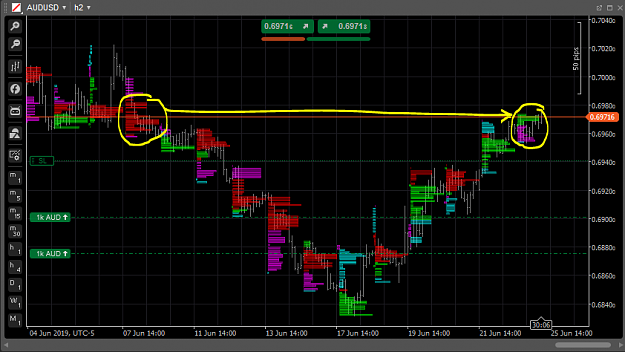
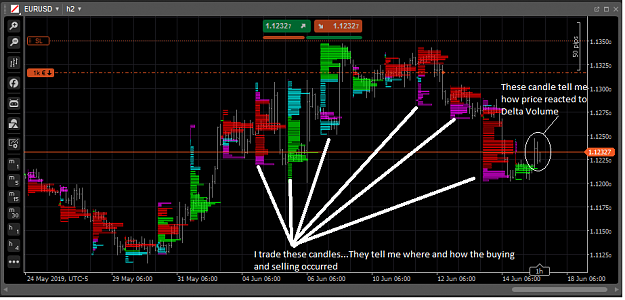
What is most important is how price reacts to the Delta volume at each price level...
- If there is "heavy" selling, price should move lower...significantly
- If there is "light" selling price should move only slightly lower.
- If there is "heaving" or "light" selling and price RISES, or ranges, there is most likely some absorption going on.
The same is true for the buying side.
So to explain your chart...you are wondering if you should buy...and looking at price now, buying would've been profitable...For me this rise is price is simply a retrace back into the area where the heavy selling occurred. The buying that occurred today may be some short term selling profit taking or stop outs...but it (IMHO) is NOT an area where I would consider new long positions. But that's me, and my time horizon is 3-5 days to 3-8 weeks. I do not use FX to trade intraday...I think that's suicide with your money.
I am now looking for another leg down on this market...
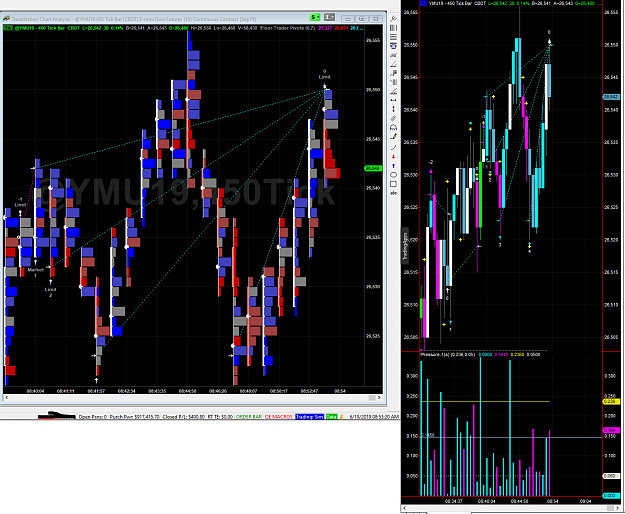
Attached Image (click to enlarge)
@xxxx§|[::::::::::::::::>
4