Hi Nih98,
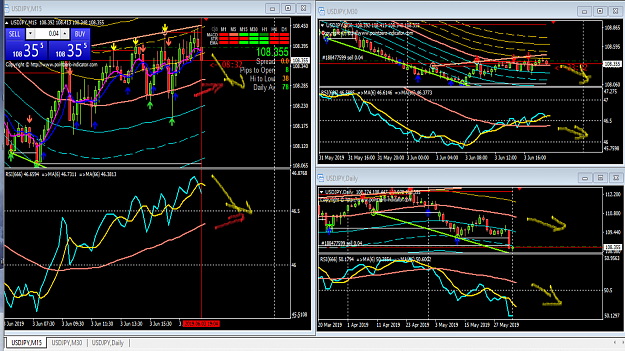
The idea is to trade on the confluence of TMA bands and the weekly high-low (or open-close) average range in pips or percentage.
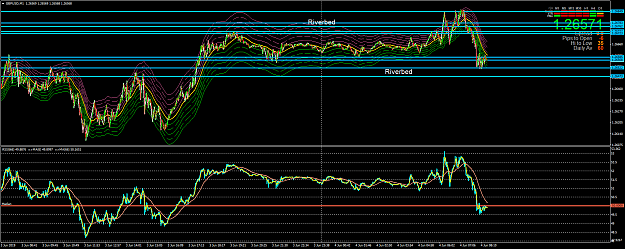
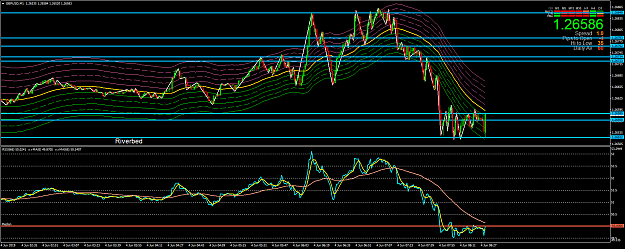
Make the weekly average range as our measurement foot rule to probe the riverbed (bottom) and top zone formations.
Can you please incorporate in the same indicator an option of printing hi-low or open-close weekly range with a multiplication factor to look back at the past to find the pattern of riverbed formation?
And also print the future Vertical timeline when the exhaustion (top) or accumulation (bottom) is anticipated to happen.
Two inputs will be needed.
1. For drawing horizontal lines or shadow from high and low or open-close of the intended weekly range extending (both in the past and in the future) up to past Date, Time and Year selected to study the pattern and to future Date, Time and Year to predict the future.
2. Weekly average range to be filtered by a factor input by the user. Multiplication Factor can be anything from negative 0.10 times to positive 10 times. Negative 0.10 times good for short-term trading. Positive 1o times good for Medium-term swing trading or Position.
Examples for the short term:
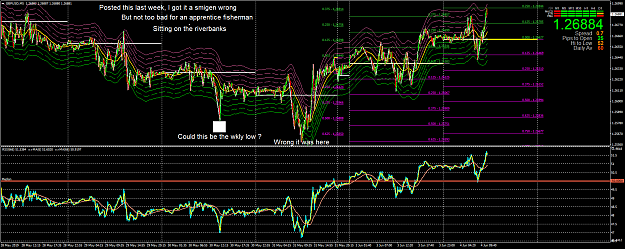
If I think bottom riverbed is forming then let me probe the bottom by using the negative factor of the average weekly range.
Like in case of Brexit, if I think the sterling is likely to go up in next 8 weeks by 10 times of weekly range size, then I will be waiting for the TMA waves to approach the Signpost and decide what to do. Sell or buy further.
The indicator will print a Bar of the size of 10 of the weekly range on 26th July, Tokyo or Frankfurt or London or New York Server time in hours chosen by me.
3. Email/notification alert distance will be useful for a mobile trader like me.
I am giving this idea emanating from my actual experience during Brexit.
The idea is to trade on the confluence of TMA bands and the weekly high-low (or open-close) average range in pips or percentage.
Make the weekly average range as our measurement foot rule to probe the riverbed (bottom) and top zone formations.
Can you please incorporate in the same indicator an option of printing hi-low or open-close weekly range with a multiplication factor to look back at the past to find the pattern of riverbed formation?
And also print the future Vertical timeline when the exhaustion (top) or accumulation (bottom) is anticipated to happen.
Two inputs will be needed.
1. For drawing horizontal lines or shadow from high and low or open-close of the intended weekly range extending (both in the past and in the future) up to past Date, Time and Year selected to study the pattern and to future Date, Time and Year to predict the future.
2. Weekly average range to be filtered by a factor input by the user. Multiplication Factor can be anything from negative 0.10 times to positive 10 times. Negative 0.10 times good for short-term trading. Positive 1o times good for Medium-term swing trading or Position.
Examples for the short term:
If I think bottom riverbed is forming then let me probe the bottom by using the negative factor of the average weekly range.
Like in case of Brexit, if I think the sterling is likely to go up in next 8 weeks by 10 times of weekly range size, then I will be waiting for the TMA waves to approach the Signpost and decide what to do. Sell or buy further.
The indicator will print a Bar of the size of 10 of the weekly range on 26th July, Tokyo or Frankfurt or London or New York Server time in hours chosen by me.
3. Email/notification alert distance will be useful for a mobile trader like me.
I am giving this idea emanating from my actual experience during Brexit.
Practice makes a person perfect
1