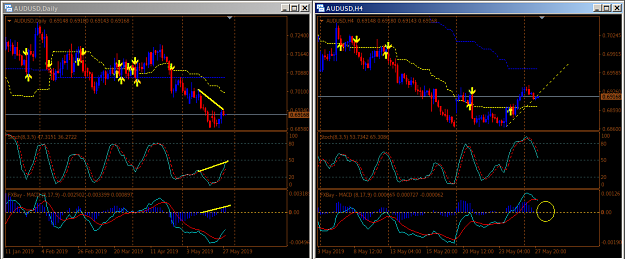
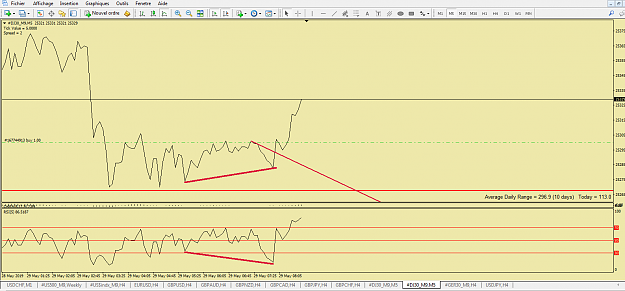
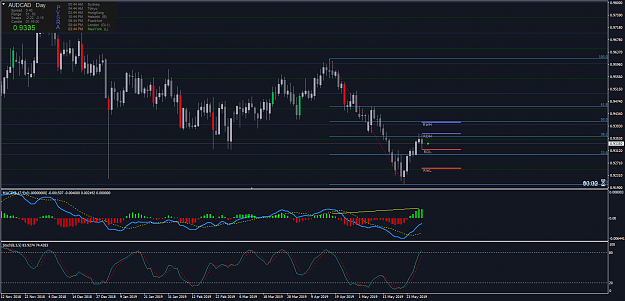
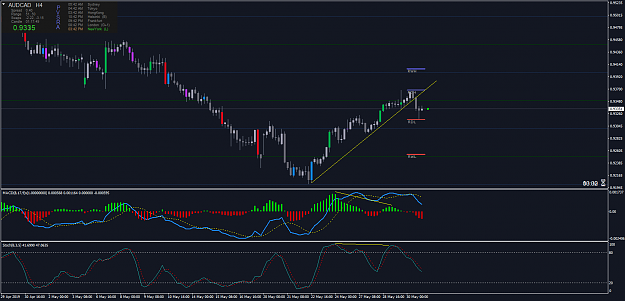
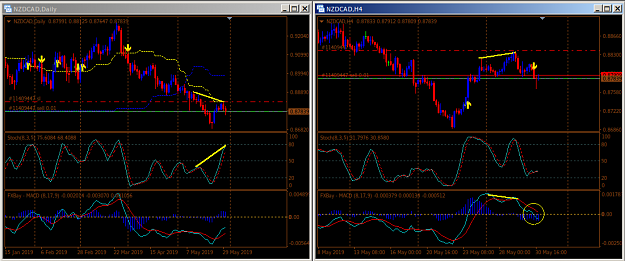
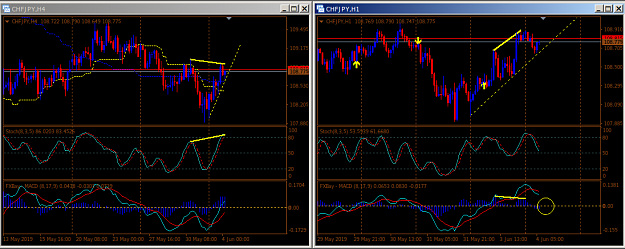
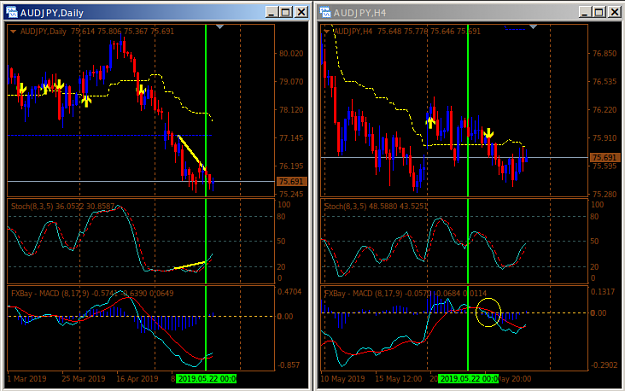
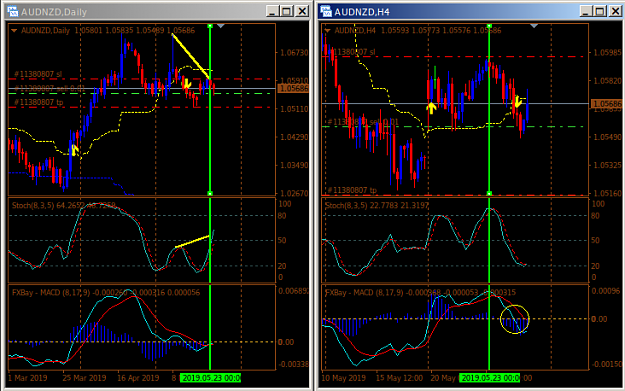
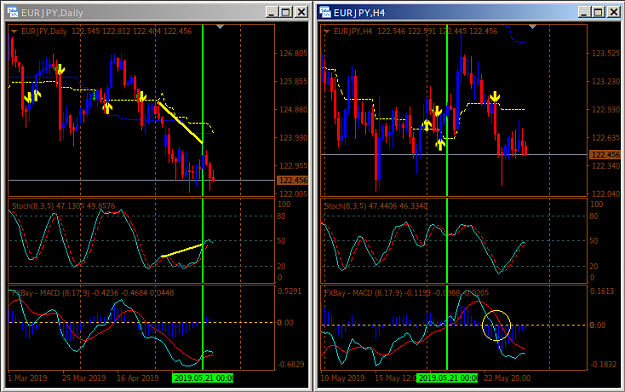
Here are three pairs that had a recent hidden divergence pattern on the Daily chart and an entry on the 4 HR chart (yellow circles) this week.
Attached Image (click to enlarge)
Attached Image (click to enlarge)
Attached Image (click to enlarge)
1