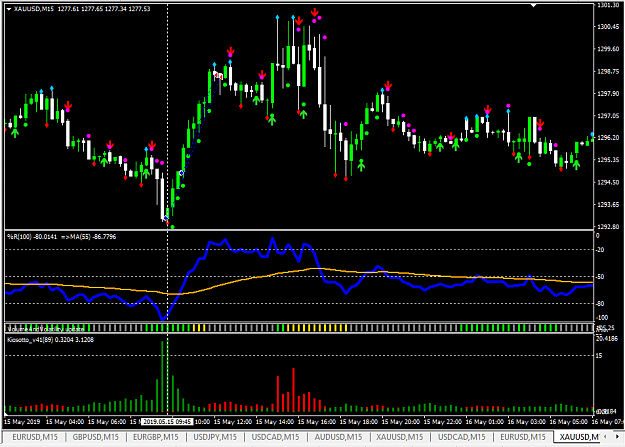
DislikedMost are labeled in the comments in the pic. I am trading gold 15min to daily ChrisIgnored
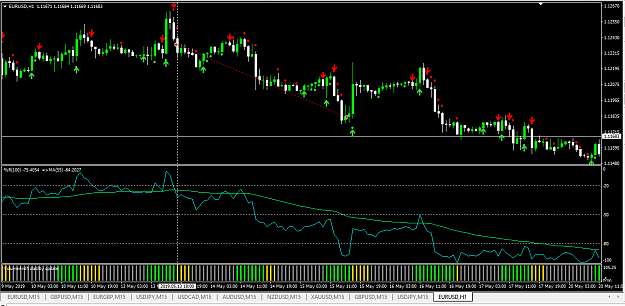
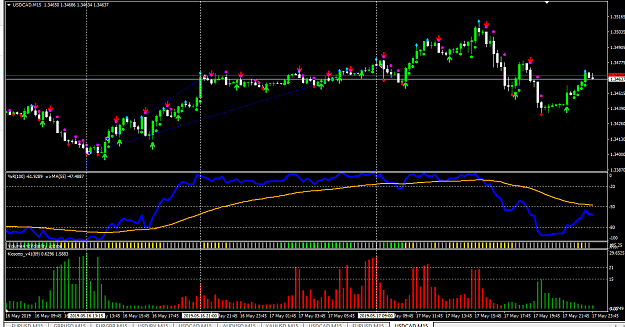
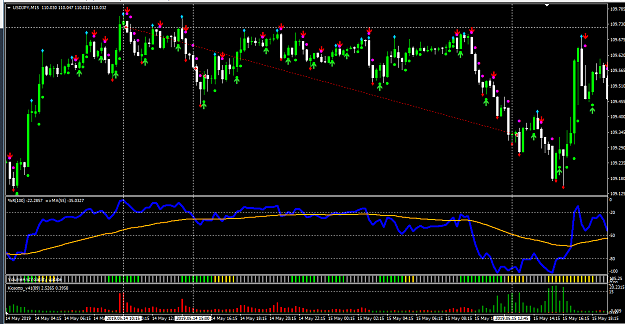
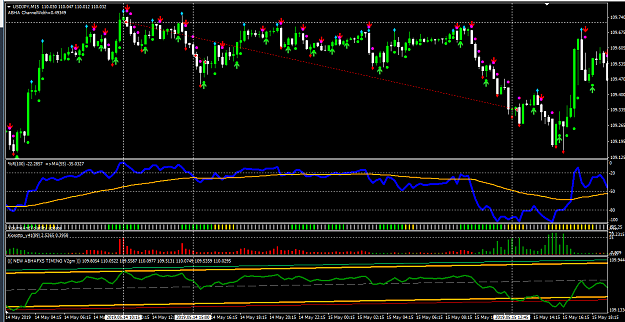
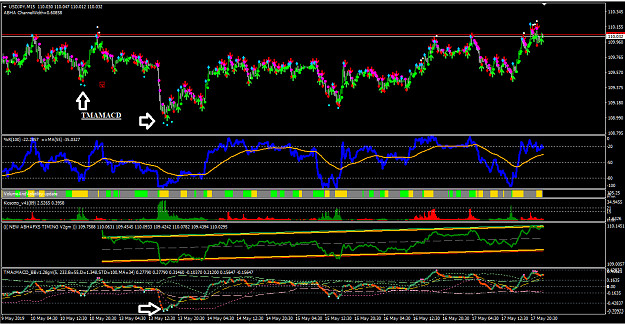
 Consecutive Candles Williams %R and Volume with 55EMA Baseline
- #111
- Edited 10:55am May 18, 2019 10:25am | Edited 10:55am
Wherever you go, there you are (Jon Kabat-Zinn)
- #118
- Edited 5:35pm May 18, 2019 5:20pm | Edited 5:35pm
Wherever you go, there you are (Jon Kabat-Zinn)