• Home
  • Forums
  • Trades
  • News
  • Calendar
  • Market
  • Brokers
  • Login
  • Join
  • User/Email: Password:
  • 7:15am
Menu
  • Forums
  • Trades
  • News
  • Calendar
  • Market
  • Brokers
  • Login
  • Join
  • 7:15am
Sister Sites
  • Metals Mine
  • Energy EXCH
  • Crypto Craft

Options

Bookmark Thread

First Page First Unread Last Page Last Post

Printable Version

Similar Threads

17 Consecutive Red Candles 0 replies

Consecutive candles indi combined with volume & spread indi 13 replies

Calculating only buy candles vs sell candles 2 replies

Code To Check If There Are Consecutive Sell or Buy Candles 1 reply

natural gas - 10 consecutive red candles in a row 10 replies

  • Trading Discussion
  • /
  • Reply to Thread
  • Subscribe
  • 13
Attachments: Consecutive Candles - trading system idea
Exit Attachments

Consecutive Candles - trading system idea

  • Last Post
  •  
  • Page 1 2
  • Page 1 2
  •  
  • Post #1
  • Quote
  • First Post: Nov 29, 2015 4:59pm Nov 29, 2015 4:59pm
  •  nollej
  • | Joined Oct 2009 | Status: one day ill get it all... | 247 Posts
Hey guys, while doing the usual weekend studies I came up with a simple idea after reading a strategy about buying or selling after 7 consecutive day days either up or down.. So if 7 down days, buy on open, and opposite for 7 up days..
Using this and a handy script Ive had for a while I thought it should be simple to do. Although waiting for 7 up or down consecutive candles on the daily would be very rare maybe coming down to 4-5 would be more suitable.
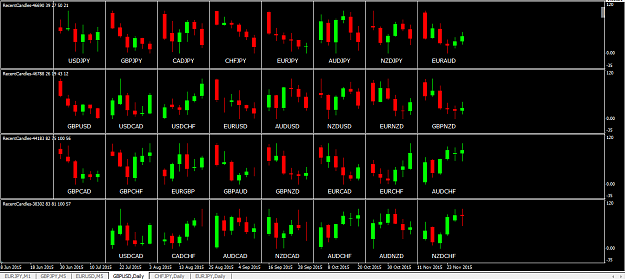
So I set up a mt4 to show most of the pairs and their recent daily candles.
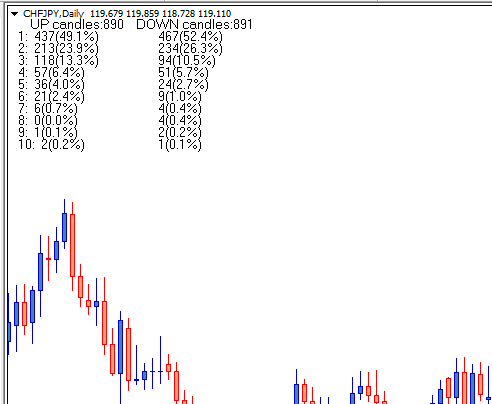
Then using the script Ill attach I can run it on the daily chart and it pops up with the statistics as shown in the top of my screencap. So we see the occurrence of each possible combinations of candles.. So example there were 36 occurrences of 5 up candles and 24 occurrences of 5 down candles over the data I have..
So then looking at the percentages I would add up the percentages before the 5 consecutive eg (49.1+23.9+13.3+6.4) to get 92.7.. So 92.7 of the time we get 4 or less consecutive candles..Meaning that only 7.3 percent of the time we get more than 4 candles for this pair.. Running it on the daily of a few others you see alot come out roughly the same. So looking at my minicharts I quickly see CHFJPY has come down 4 days so would be looking to long somewhere possibly.
Using this we could just scan the little chart each day and wait for our 4-5 consecutive candles and then check with the script if the pair to check. Then simply place a buy or sell on open or look for a really obvious place for it to turn such as daily low/high..
Anyone done anything like this before or have some opinions?
Attached Image (click to enlarge)
Click to Enlarge

Name: Minicharts.png
Size: 46 KB
Attached Image
Attached Files
File Type: ex4 sqConsecutiveCandlesStatistics (1).ex4   13 KB | 937 downloads
File Type: mq4 sqConsecutiveCandlesStatistics (1).mq4   4 KB | 1,148 download
nollej is power..
  • Post #2
  • Quote
  • Nov 30, 2015 3:23am Nov 30, 2015 3:23am
  •  hanover
  • Joined Sep 2006 | Status: ... | 8,081 Posts
Some general comments, and ideas you might like to try:

 Overall I believe the concept has underlying justification, i.e. the longer a move progresses, the greater the probability of profit taking/counter trend traders entering.

 The longer the timeframe, the better this will probably work (due to collective averaging, greater cross section of participants).

 Basically you're using number of consecutive candles as a measure of overbought/oversold. The question is whether consecutive candles (time) or pips/ATRs moved (price) is a better measure -- you could test this.

 Combining OB/OS with S/R (like the attached indicators) could potentially work better.

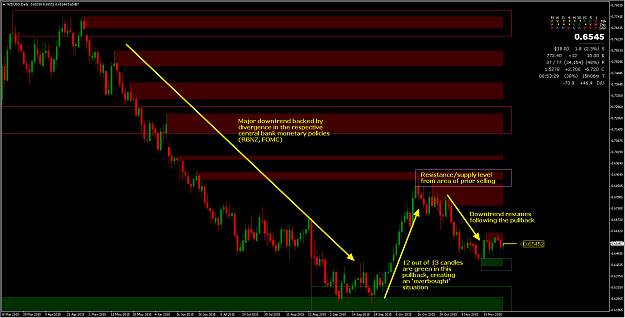
 An OB/OS reflecting a pullback in a major trend, especially if that trend is backed by high priority fundamentals (or, in lieu of FA, is the strongest trending pair), would likely further improve the probabilities.

 As always, much will depend on your exits (SL, profit exit).

The screenshot is by no means a perfect example, as there's one red candle breaking the 13 green candle pullback sequence, and there are failed resistance zones that have been blown away by the pullback, but hopefully it illustrates the concepts I'm attempting to demonstrate.

Hope that gives you some ideas to test further. Just my 2c.

David
Attached Image (click to enlarge)
Click to Enlarge

Name: PPI 136.png
Size: 54 KB
Attached Files
File Type: ex4 SS_SupportResistance_v07 (1).ex4   79 KB | 555 downloads
File Type: ex4 II_SupDem v2.ex4   35 KB | 497 downloads
2
  • Post #3
  • Quote
  • Edited at 8:09am Nov 30, 2015 5:37am | Edited at 8:09am
  •  nollej
  • | Joined Oct 2009 | Status: one day ill get it all... | 247 Posts
Quoting hanover
Disliked
Some general comments, and ideas you might like to try:  Overall I believe the concept has underlying justification, i.e. the longer a move progresses, the greater the probability of profit taking/counter trend traders entering.  The longer the timeframe, the better this will probably work (due to collective averaging, greater cross section of participants).  Basically you're using number of consecutive candles as a measure of overbought/oversold. The question is whether consecutive candles (time) or pips/ATRs moved (price)...
Ignored
Hey Hanover,
Firstly thanks to you for the recent candles indicator I use here, plus a few others Ive tinkered with
Yes I believe it would definitely be something to stick with on the high timeframe since I have looked at doing the same with small timeframes but the moves are obviously very small possibly, so a small pin or doji on the 5 min is alot different profit potential to a daily cande of the same nature.
I do see it as the same (overbought/oversold) but I like the way we can actually see using the script, that in the past we know the expected likelihood over a large enough sample. This is alot harder to visually do say using an indicator or pattern play.
Yes i was looking at the atr a little while back and this could go well with using the monthly or weekly atr values. May need to investigate further..
Definitely the sl/tp is the trickiest part since when looking at the charts these reverse candles may not always be big ones. So it may just be a small pullback candle before it resumes again. This will be something I need to see what idea will work best
Funny there was such a large run on NZDUSD recently, running the script that 7 run of up candles made the 3rd only time with my data according to the script..
Thanks for the 2c, alot of small change can make a big difference

Josh
Attached Image
nollej is power..
1
  • Post #4
  • Quote
  • Dec 3, 2015 11:22am Dec 3, 2015 11:22am
  •  Anusragger
  • | Joined Nov 2012 | Status: No Impact Member (bottom 1%) | 734 Posts
It would be nice if we could input times in the script so we can exclude times without liquidity. The percentages could be skewed because of asian range.
  • Post #5
  • Quote
  • Dec 3, 2015 1:52pm Dec 3, 2015 1:52pm
  •  nollej
  • | Joined Oct 2009 | Status: one day ill get it all... | 247 Posts
Quoting Anusragger
Disliked
It would be nice if we could input times in the script so we can exclude times without liquidity. The percentages could be skewed because of asian range.
Ignored
Yes it could be a handy feature if anyone could edit it, I only found it and use it. I think for the daily though, I am looking at the full days range anyways so no need to exclude any times. It could be useful for testing consecutive candles on the lower time frames though I think
nollej is power..
1
  • Post #6
  • Quote
  • Dec 4, 2015 1:41am Dec 4, 2015 1:41am
  •  Anusragger
  • | Joined Nov 2012 | Status: No Impact Member (bottom 1%) | 734 Posts
Quoting nollej
Disliked
{quote} Yes it could be a handy feature if anyone could edit it, I only found it and use it. I think for the daily though, I am looking at the full days range anyways so no need to exclude any times. It could be useful for testing consecutive candles on the lower time frames though I think
Ignored
Ah right. I was looking at the h1 and finding an entey at the m1.
  • Post #7
  • Quote
  • Dec 4, 2015 4:35am Dec 4, 2015 4:35am
  •  shellsnail
  • Joined Aug 2012 | Status: Trends, Levels, Confirmation, Bayes | 1,834 Posts
Quoting nollej
Disliked
Hey guys, while doing the usual weekend studies I came up with a simple idea after reading a strategy about buying or selling after 7 consecutive day days either up or down.. So if 7 down days, buy on open, and opposite for 7 up days.. Using this and a handy script Ive had for a while I thought it should be simple to do. Although waiting for 7 up or down consecutive candles on the daily would be very rare maybe coming down to 4-5 would be more suitable. So I set up a mt4 to show most of the pairs and their recent daily candles. Then using the script...
Ignored
Shouldn't the question you want to ask be,

GIVEN that X number of consecutive UP/DOWN candles has occurred, what is the probability that the next candle is UP/DOWN.

To me it makes no sense to look at a priori odds.

Given a large enough sample size, I believe you'll find that it's close to 50% (i.e. there's no edge)

If you think you found an "edge", there's also the question of which way should you exploit it i.e. whether you want to trade for reversion to the mean (meaning the edge disappears) OR you want to trade the edge for what it is.

I believe if you combine this with a LEVEL or some other variables an entry edge may appear..

This can really help if you use it on the daily chart. If you do find a strange probability then you can possibly exploit it to get directional conviction/trend bias on a particular day. For example the stockmarket SPY is known to have some of these quirks.

Might also want to consider extent of move. i.e. after a 2% daily up move, what is the probability the next day is down?
Build good relationships with others.
2
  • Post #8
  • Quote
  • Dec 4, 2015 4:48am Dec 4, 2015 4:48am
  •  nollej
  • | Joined Oct 2009 | Status: one day ill get it all... | 247 Posts
Quoting shellsnail
Disliked
{quote} Shouldn't the question you want to ask be, GIVEN that X number of consecutive UP/DOWN candles has occurred, what is the probability that the next candle is UP/DOWN. To me it makes no sense to look at a priori odds. Given a large enough sample size, I believe you'll find that it's close to 50% (i.e. there's no edge) If you think you found an "edge", there's also the question of which way should you exploit it i.e. whether you want to trade for reversion to the mean (meaning the edge disappears) OR you want to trade the edge for what it is....
Ignored
Yes that is the point of the statistics. Knowing that a certain number of candles has occurred up/down then knowing, using the past actions, that it has a certain probability (based on previous data) to go the other direction.Of course I dont know for how long though thats the problem
Using the script you are correct that over the daily bars at least, alot of currencies have a an even spread of bars that were only singular (50% of the time).
I think hanover described it well that it is merely a view of overbought/oversold technically. I am just testing it as I have a concrete number that over a certain data set I know if a set of 3/4/5/6 candles has occurred then I know the probability (based on previous data) that the next candle will go (should go)in the opposite direction.
Definitely the trading of it it is the trickiest part, at the moment just looking at one hour reversal candles at certain levels eg (daily lows, s/r) and seeing how they tie in..
Josh
nollej is power..
1
  • Post #9
  • Quote
  • Dec 5, 2015 6:07pm Dec 5, 2015 6:07pm
  •  ruckser
  • | Joined Dec 2015 | Status: Member | 4 Posts
Nice idea, there is a guy created EA based on this idea but it was BO EA.
  • Post #10
  • Quote
  • Dec 6, 2015 2:07pm Dec 6, 2015 2:07pm
  •  rewand
  • | Joined Feb 2011 | Status: Member | 90 Posts
I tried stg similar few years back. No one could refute the validity of the idea until now, it is only that I have not found a programmer to complete the EA. After many years (that I have traded through) I still believe that the strategy would make money in the form of an EA.
But to the point.. I believe that when you use a succession of candles and try to infer from their behaviour to future PA you cant ignore the full characteristics of the candles. OHLC data and the behaviour of candles relative to at least the neighbouring candles should be interpreted. In case of 7 candles the datapoints (the pure OHLC data and all meanings attributed to them, you will need to define all variables that you want to factor in to make decisions) are plenty that would result in plenty of patterns over time and you would have to identify similar patters in your dataset to conclude that there are patterns suggesting high probability trades to bet on in the future. Not impossible but even my strategy with few candles to interpret was too difficult for people to understand and I have had to abandon my idea for years.
If you simplified the reading of candles, say long or short candles, you would risk missing important signals the candles may give, simply because you cant prove that there are other signals the same candles give you until you have looked at all properties of the candles and all patterns these candlles provide through them.
Another difficulty is that you need to associate the identified patterns with past results to know where to enter and where to exit from the identified trades.
1
  • Post #11
  • Quote
  • Dec 6, 2015 2:34pm Dec 6, 2015 2:34pm
  •  ForexQuant
  • Joined Jan 2010 | Status: Member | 519 Posts
(Been a lurker for long long time... )

Your data seems incorrect. Let's take CHFJPY chart in your 1st post for example, there is zero 8-consecutive up candle. If so, how could it possible to have one 9-consecutive up candle?

Anyway, consecutive up or down alone wont provide you any statistical edge. If you have big enough sample size, you will notice that the next candle always has 50/50 chance of going up/down in regardless of its current consecutive up/down. This scenario is exactly same like a coin flips. Even if you have 7 consecutive head, the chances of getting head in your next flip is still 50%.

Let's say if you have 10000 sample size, then your number of consecutive up/down candle will look similar to this:

1. ~50.00%
2. ~25.00% (50% of 1-consecutive up/down)
3. ~12.50% (50% of 2-consecutive up/down)
4. ~6.250% (50% of 3-consecutive up/down)
5. ~3.125% (50% of 4-consecutive up/down)
6. and so on...

If you do not have enough sample size for daily candle, try use smaller time frame. I can assure you that no matter which time frame you use, the result is always 50/50.
2
  • Post #12
  • Quote
  • Dec 6, 2015 3:56pm Dec 6, 2015 3:56pm
  •  alphaomega
  • Joined Aug 2010 | Status: Stare Into the Lights My Pretties! | 748 Posts
Quoting nollej
Disliked
Hey guys, while doing the usual weekend studies I came up with a simple idea after reading a strategy about buying or selling after 7 consecutive day days either up or down.. So if 7 down days, buy on open, and opposite for 7 up days.. Using this and a handy script Ive had for a while I thought it should be simple to do. Although waiting for 7 up or down consecutive candles on the daily would be very rare maybe coming down to 4-5 would be more suitable. So I set up a mt4 to show most of the pairs and their recent daily candles. Then using the script...
Ignored

Your idea is good, although it's nothing new.
However, counting candles is not the most efficient way to do this type of statistical analysis.
I can propose better alternative!
A much better way will be to calculate the average expected range of a continuous basis, and then to trade counter trend when the current range become too big (for example 3X, or 4X the expected.......)
First you have to decide what time frame unit you want. (in your case 1 day).
Then do the following:
1. Calculate the average daily range (for example ATR 20)
2. Calculate the average expected range for any time frame you want
(in your case 2, 3, 4, 5, 6, 7, 8, 9, 10 days)
3. Compare the current range with the expected range for each time frame. And based on the result you can apply the appropriate strategy.....

How to calculate the average expected range for any timeframe?
It's VERY easy!
Take the base unit (in this case ATR 20 for D1) and multiply it by the square root of the time frame.
Example:
If ATR 20 = 100
then avg. exp. range for:
2 days = 100 * 1.4142.......
3 days = 100 * 1.7320.......
...............
and so on .... this way you can calculate for ANY time frame you want.
The key part is to calculate everything on continuous basis with the most resent data.

Some years ago I traded with such strategy........ and I think there is still alot of potential here!
2
  • Post #13
  • Quote
  • Dec 8, 2015 10:06am Dec 8, 2015 10:06am
  •  nollej
  • | Joined Oct 2009 | Status: one day ill get it all... | 247 Posts
Quoting rewand
Disliked
I tried stg similar few years back. No one could refute the validity of the idea until now, it is only that I have not found a programmer to complete the EA. After many years (that I have traded through) I still believe that the strategy would make money in the form of an EA. But to the point.. I believe that when you use a succession of candles and try to infer from their behaviour to future PA you cant ignore the full characteristics of the candles. OHLC data and the behaviour of candles relative to at least the neighbouring candles should be...
Ignored
I agree you cannot simply take the consecutive candles without looking at their appearance as well as where they are located..As mentioned the tricky part is what to do with the idea that price "should" reverse based on previous data, but finding at what point and where too is where you need another entry/exit criteria.. At the moment looking at break out of previous day high/lows with an obvious kind of reversal pattern.. (may be as simple as a pin bar on the hourly or something similar)
nollej is power..
1
  • Post #14
  • Quote
  • Dec 8, 2015 10:30am Dec 8, 2015 10:30am
  •  nollej
  • | Joined Oct 2009 | Status: one day ill get it all... | 247 Posts
Quoting ForexQuant
Disliked
(Been a lurker for long long time... ) Your data seems incorrect. Let's take CHFJPY chart in your 1st post for example, there is zero 8-consecutive up candle. If so, how could it possible to have one 9-consecutive up candle? Anyway, consecutive up or down alone wont provide you any statistical edge. If you have big enough sample size, you will notice that the next candle always has 50/50 chance of going up/down in regardless of its current consecutive up/down. This scenario is exactly same like a coin flips. Even if you have 7 consecutive head,...
Ignored
I think the data seems correct, my assumption is the script only calculates a finished consecutive count. I have visually tested it over a count of the previous 200 candles to make sure it was doing what I thought it was doing So if we get 5 candles up it counts that as one count of 5 candles up, but not including all the preceding consecutive counts. eg 1,2,3,4... So from my first example it tells us there has not been any instances of 8 consecutive up candles, but as the script says 1 count of 9 and 2 of 10.
I did make an excel table of most of the main pairs running the script on them and it is interesting that the numbers do come out approximately as you say.. see attached (values show probability of continuing after the corresponding number of candles have passed).. You are also correct that most of the other time frames have the same 50/50 probability for 1 up/down candles as I have seen..
I wouldn't go to say that using consecutive candles alone would not give an edge as the numbers say otherwise, extreme example, using my first CHFJPY again, there have only been a total of 3, 10 consecutive up/down strings of candles over the data I have. I would dare say if we ever got such a streak again blindly betting the next day would be opposite in close would be a far more than 50% chance of happening..
But where it closes, entry and exit are the parts that make it tricky, as the next day to break whatever streak may only be a fraction of movement in comparison. I wouldn't like to blindly bet the next day will close opposite but I think waiting for a streak of consecutive candles gives a good indication that we are in line for some kind of reversal. Again as hanover stated, possibly this is merely another way to judge how overbought/oversold we are.
Attached File
File Type: xls Consecutivepairs.xls   13 KB | 486 downloads
nollej is power..
1
  • Post #15
  • Quote
  • Dec 8, 2015 10:37am Dec 8, 2015 10:37am
  •  nollej
  • | Joined Oct 2009 | Status: one day ill get it all... | 247 Posts
Quoting alphaomega
Disliked
{quote} Your idea is good, although it's nothing new. However, counting candles is not the most efficient way to do this type of statistical analysis. I can propose better alternative! A much better way will be to calculate the average expected range of a continuous basis, and then to trade counter trend when the current range become too big (for example 3X, or 4X the expected.......) First you have to decide what time frame unit you want. (in your case 1 day). Then do the following: 1. Calculate the average daily range (for example ATR 20) 2. Calculate...
Ignored
Yes I never imagined its anything super duper or the such, but I just like how I can look at the previous data and have a definite value of how many times in the past this has occurred and how likely it i to continue. It is alot harder to test how many times a trendline or previous support/resistance has held, or how ofter price has moved away when in the 80/20 ranges of an oscillator, etc..
As mentioned I do think looking at where price has pushed to after such a streak has occurred as well as relating that to the atr (possibly weekly/montly) or the way you have stated here will definitely give the idea a better edge. Cheers for the idea, will have a look at it
nollej is power..
  • Post #16
  • Quote
  • Dec 8, 2015 11:06am Dec 8, 2015 11:06am
  •  Kilian19
  • Joined Jan 2011 | Status: Currently in Asia | 839 Posts
Quoting nollej
Disliked
...
Ignored

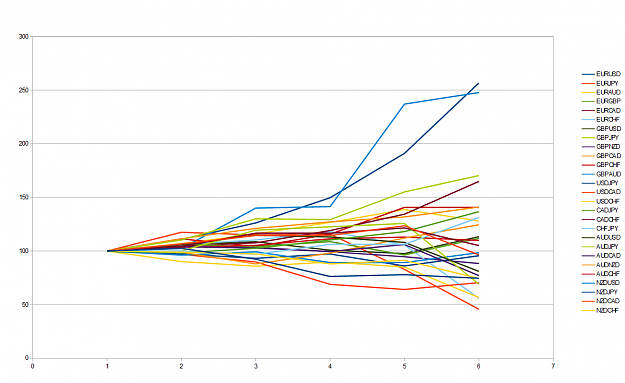
Using your file attached I came to those results looking at the values for long only. In a perfectly random 50:50 market the line is supposed to stay flat all the time. As you see on the NZD/USD line between the 3rd and the 4th candle roughly half the candles after the 3rd up candle are either up or down.

Interesting are pairs where there is a huge or constant deviation (e.g. NZD/USD or NZD/JPY which moves constantly higher indicating that the likelihood of the opposite color is not 50%)

The first value of every pair is fitted to 100 and the same factor is applied to each consecutive value of the symbol.
After that I calculated the x candle value with "value*2^(x-1)"
Attached Image (click to enlarge)
Click to Enlarge

Name: CandleDirection.png
Size: 67 KB
1
  • Post #17
  • Quote
  • Dec 8, 2015 11:27am Dec 8, 2015 11:27am
  •  nollej
  • | Joined Oct 2009 | Status: one day ill get it all... | 247 Posts
Quoting Kilian19
Disliked
{quote} Using your file attached I came to those results looking at the values for long only. In a perfectly random 50:50 market the line is supposed to stay flat all the time. As you see on the NZD/USD line between the 3rd and the 4th candle roughly half the candles after the 3rd up candle are either up or down. Interesting are pairs where there is a huge or constant deviation (e.g. NZD/USD or NZD/JPY which moves constantly higher indicating that the likelihood of the opposite color is not 50%) The first value of every pair is fitted to 100 and...
Ignored
Yes not sure what makes NZDUSD/NZDJPY so special. Graphs always make things look pretty
nollej is power..
  • Post #18
  • Quote
  • Dec 8, 2015 11:29am Dec 8, 2015 11:29am
  •  Kilian19
  • Joined Jan 2011 | Status: Currently in Asia | 839 Posts
Quoting nollej
Disliked
{quote} Yes not sure what makes NZDUSD/NZDJPY so special. Graphs always make things look pretty
Ignored
Increase the sample size and look at it again. If it stays the same go and bet on binaries and be happy that you found a pattern you can profit from.
  • Post #19
  • Quote
  • Dec 8, 2015 11:35am Dec 8, 2015 11:35am
  •  nollej
  • | Joined Oct 2009 | Status: one day ill get it all... | 247 Posts
Quoting Kilian19
Disliked
{quote} Increase the sample size and look at it again. If it stays the same go and bet on binaries and be happy that you found a pattern you can profit from.
Ignored
Yes I thought about binaries as they would provide a simpler way to trade such an occurrence as we wouldn't need to worry about where to enter/exit, only need to have an edge on what side she closes
nollej is power..
  • Post #20
  • Quote
  • Dec 8, 2015 11:38am Dec 8, 2015 11:38am
  •  Kilian19
  • Joined Jan 2011 | Status: Currently in Asia | 839 Posts
Quoting nollej
Disliked
{quote} Yes I thought about binaries as they would provide a simpler way to trade such an occurrence as we wouldn't need to worry about where to enter/exit, only need to have an edge on what side she closes
Ignored
Well don't get too excited. These are always the quick assumptions one can draw but if you take a closer look at the numbers most of the time they turn out to just give you a temporary edge. Binaries would be easy to trade this kind of "appearance" but the more profitable way would be to take a look at the size of the reversal candle and factor this into your trading strategy. Sticking to spot is preferable most of the time.

Quoting hanover
Disliked
..
Ignored
By looking at your picture it is interesting to see that the reversal candle after an extended trend is usually just a short correction and the following candle continues in the direction of the predefined trend. Maybe we can trade this candle.
  • Trading Discussion
  • /
  • Consecutive Candles - trading system idea
  • Reply to Thread
    • Page 1 2
    • Page 1 2
0 traders viewing now
  • More
Top of Page
  • Facebook
  • Twitter
About FF
  • Mission
  • Products
  • User Guide
  • Media Kit
  • Blog
  • Contact
FF Products
  • Forums
  • Trades
  • Calendar
  • News
  • Market
  • Brokers
  • Trade Explorer
FF Website
  • Homepage
  • Search
  • Members
  • Report a Bug
Follow FF
  • Facebook
  • Twitter

FF Sister Sites:

  • Metals Mine
  • Energy EXCH
  • Crypto Craft

Forex Factory® is a brand of Fair Economy, Inc.

Terms of Service / ©2021