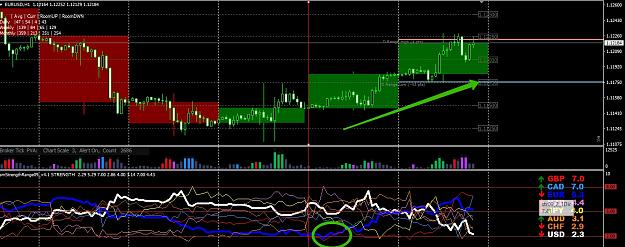
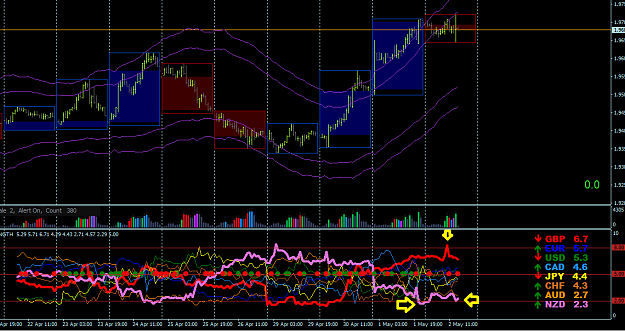
Disliked{quote} thats tick volume analysis.... climax volume candles are stopping volumes... many would say the volumes on cfds are not reliable... but time has proven that tick volume actually works (at least gives us reliable tips in our analysis).... it is a means of recognizing interesting price regions on your chart... when volume climax... it is important to know where? ...contextually speaking... volume activity gives us clue to market makers, smart money and dumb money activity... and not just that it also gives us tip on how market makers can manipulate...Ignored
So you are telling me that it is practically used in the distribution / accumulation phases, where there are often stop hunts
So if we find a climax colored candle (according to the indicator, red and green) in these "phases" it is most likely a false trend start only to capture stop.
Was this what you meant? I already use these concepts, but with the naked eye
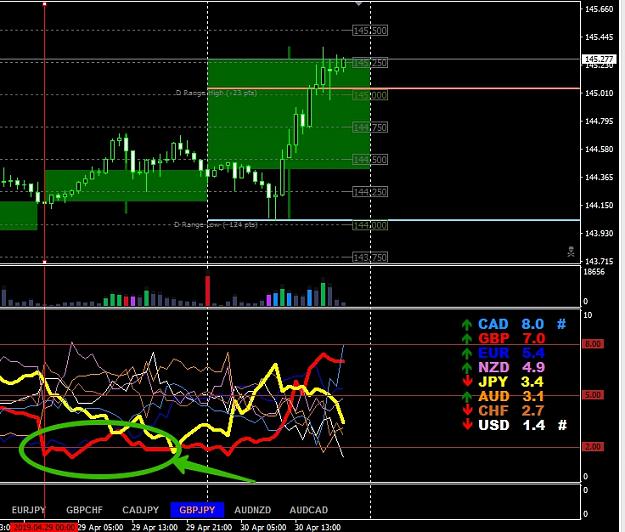
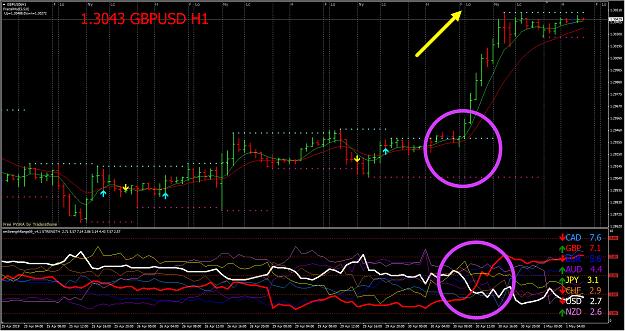
![Click to Enlarge
Name: [GBPCHF,H1] signal.jpg
Size: 428 KB](/attachment/image/3326095/thumbnail?d=1556647084)