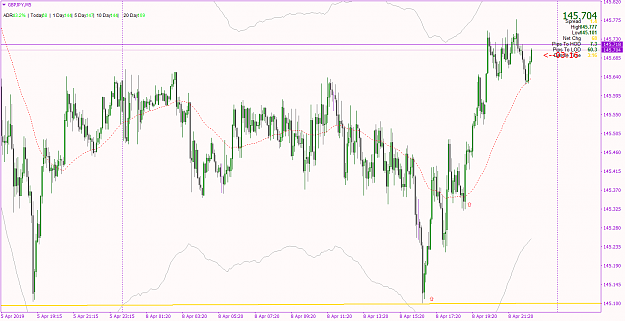
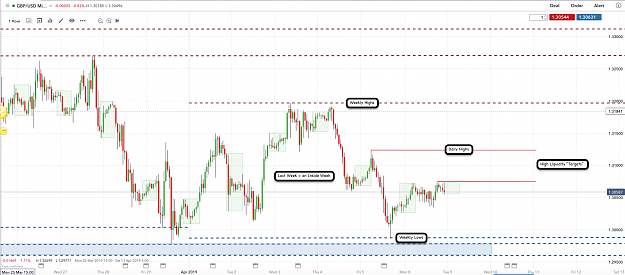
DislikedSo, whilst I have been taking in the advice e.g. marking up lows and valleys, and re-reading each analysis, something from posts 38 and 41 really stood out for me. Looking at the chart in post 38, it suddenly started to reveal a pattern which I have highlighted. I am continuing to look through blank charts and hopefully identifying and interpreting market structure correctly. George's original is highlighted with yellow and then mine (which I hope is correct) in magenta. During that day 25/01 and using different time-frames, I think I am starting...Ignored
Very good...
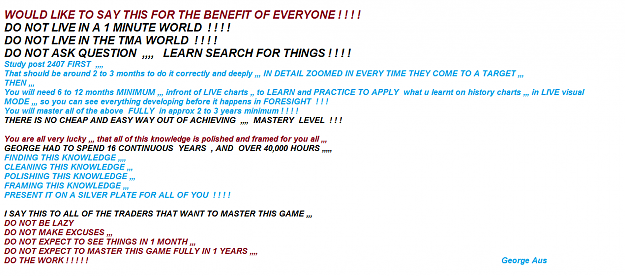
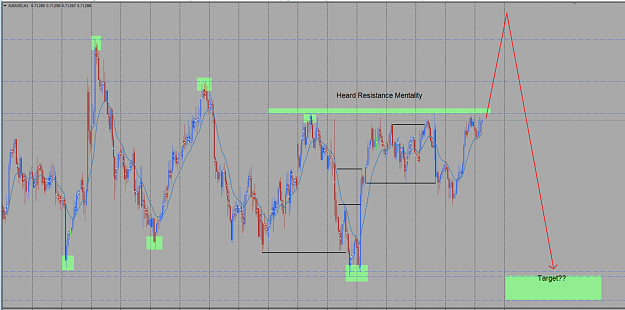
The TMAS are the absolute last thing to look at.. they are only used for entries.
This is all about market psychology...
Cheers
Kevin
Markets are Mirrors,,Mastery of craft is mastery of self
3